Mathematics Vision Project
Equations and Inequalities
Help learners get their facts in line to build and solve complicated linear equations and inequalities. Pupils build upon their knowledge of solving basic equations and inequalities to solve more complex ones. Individuals work with...
Curated OER
Graphing Linear Equations
Ninth graders review the information that they have already learned
with regard to linear equations and graphical representations. They then assist in combining equations with a graphical element and complete various graphs with this...
Curated OER
Slopes of Lines
Students examine a graph and relate it to the real world situation it depicts. They investigate changes in an equation and the appearance of a line. They investigate the connection between the graph of a situation and the meaning of the...
Curated OER
Getting Out of Line
Young scholars explore basic connections between graphs, tables, and symbolic representations for lines, parabolas, inverse models, and exponential models. One of the primary goals of this lesson plan is to help students begin to...
Curated OER
The Slope of a Line
In this slope worksheet, students examine graph and determine the slope of a line. They determine coordinates of a point to make a true statement. Students identify the dependent variable and the independent variable. This three-page...
Curated OER
Graphing Linear Equations
In this calculator active graphing worksheet, students graph 12 equations via a calculator and transfer the graphs onto coordinate grids.
Curated OER
Graphing Applications
In this graphing applications activity, students derive equations for 4 word problems. Students then define variables, find intercepts, graph the equations, and interpret the slopes.
Curated OER
Lines of Slope
In this lines of slope learning exercise, 9th graders solve and complete 40 various types of problems. First, they find the equation of the lines described and write in slope-intercept form. Then, students graph each equation. They also...
Curated OER
Position and Velocity vs. Time Graphs
In this position and velocity learning exercise, students sketch graphs of position vs. velocity and position vs. time for 6 problems given different scenarios. They label their graphs with given positions, velocities and times.
Curated OER
Graphing Linear Motion
In this graphing linear motion worksheet, learners answer 20 questions about velocity of objects, the distance they travel and the time. They interpret a graph of position vs. time and identify the velocity at certain point on the graph.
Curated OER
Hassan's Pictures - Linear Programming and Profit Lines
Students graph systems of linear inequalities. In this linear programming and profit lesson, students explore linear programming problems. They graph a feasible region in a linear programming problem and identify the profit lines. ...
Curated OER
Solve Linear Systems of Equations: Graphing, Substitution, and Elimination
In this system of linear equations worksheet, students solve by using graphing, substitution, and elimination. There are 44 problems.
Curated OER
Graphs
In this algebra worksheet, students solve linear equations through graphing and quadratic equations through factoring. There are 4 questions dealing with systems of equations.
Curated OER
Graphing Speed; Slope
In this graphing speed worksheet, students find the slope in a position vs. time graph to be the speed. They are given example graphs of position vs. time to show the changes in slope reflect the changes in speed. Students match terms...
Curated OER
Straight Line Motion in Two Parts
Students describe and quantify the motion of toy cars. In this motion instructional activity, students observe a battery powered toy car on a flat surface and a standard toy car on a sloped surface. They write their observations, measure...
Curated OER
Graphing
Students collect data and graph their results, then analyze the graphs. In this geometry lesson, students examine slopes and their graphs and discuss the relationship between the lines and the slopes.
Curated OER
Graphing Speed
In this graphing worksheet, students read about independent and dependant variables and learn how to determine speed from the slope of a position vs. time graph. This worksheet has 4 matching, 17 fill in the blank, and 2 problems to solve.
Curated OER
Lesson 3: Graphing Ordered Pairs on a Coordinate Plane
Students study how to graph ordered pairs on a coordinate plane. After a teacher demonstration, students work together to complete problems. They explain and share their answers. As an activity, they solve a mystery story about the...
Curated OER
M&Ms; Line Plots and Graphing
Students, using small individual bags of M&Ms, engage in activities including; estimating, sorting, graphing, mean, median, mode, fractions, percentage, and averaging.
Curated OER
Graphing Solutions
In this graphing solutions worksheet, 9th graders solve 13 various types of problems. First, they find the solution of each systems by graphing on the coordinate plane provided. Then, students solve each systems of equations...
Texas Instruments
Exploring Tangents
Explore the concept of tangent lines. In this tangent line lesson, learners graph a circle and two lines on their graphing calculator using Cabri Jr. High schoolers construct the lines so that they both intersect at a given point and are...
Curated OER
Droodle Graphs
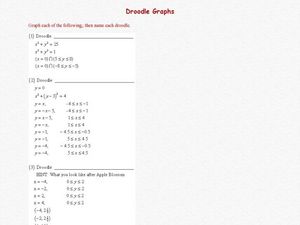
In this algebra worksheet, students graph piecewise functions, and circles using restrictions. They graph a line and chop it on both ends to create a stair case looking graph or a ladder. There are 3 involve questions with an answer key.
Texas Instruments
A Tale of Two Lines
Students graph systems of equation. In this calculus instructional activity, students graph their lines on a TI calculator. They identify the point of intersection and the type of solution.
Curated OER
Storybook Character Graph
First graders dress as their favorite storybook character. They draw a self-portrait, then place the drawing on a graph.
Other popular searches
- Line Graphs
- Double Line Graphs
- Bar and Line Graphs
- Line Pie Bar Graph
- Interpreting Line Graphs
- Line Plot Graphs
- Making Line Graphs
- Reading Line Graphs
- Analyzing Line Graphs
- Creating Line Graphs
- Number Line Graphs
- Reading Double Line Graphs


