Curated OER
Graphing Functions
For this graphing functions worksheet, learners solve and complete 13 different problems that include identifying and graphing various functions. First, they graph each of the functions shown on the graphs provided. Then, students solve...
Curated OER
The Order of Things on a Coordinate Grid
High schoolers are able to identify ordered pairs on coordinate plane, and graph points on a coordinate plane. They are able to write an ordered pair for each of the points on a graph, and create a design or picture using ordered pairs.
Curated OER
Solving Systems of Equations by Graphing
In this systems of equations worksheet, students solve each system of equations by graphing on a coordinate plane. Students identify the solution to the equations by the intersection of the two graphs. They also observe that parallel...
Curated OER
Graphing Systems of Equations
In this graphing systems of equations activity, 9th graders solve and graph 8 different problems that include solving various systems of equations. First, they use the graphs show to determine whether each system has one solution, no...
Curated OER
Graphing Polynomials
Students graph polynomial equations using different methods. In this algebra lesson, students identify the different ways the x and y values relate in a graph. They solve for x by finding the zero's of the polynomials.
Curated OER
Now, what the heck is a NUMBER LINE again???
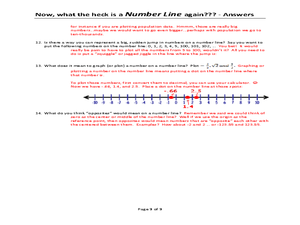
A unique approach to reviewing number lines and how to locate different values on them, this worksheet poses several questions that require written answers rather than calculations. You could use this as a note-taking guide when teaching...
Curated OER
Walk the Line
Learners create constant speed versus motion graphs. They will perform linear regressions on their data to describe the graphs mathematically.
Curated OER
Graphing the Past Using Today's Technology
Eighth graders research statistical data regarding their current social studies unit. They write questions about the measures of central tendency, collect and analyze the data, insert the data into a spreadsheet, and generate graphs.
Curated OER
Intersecting Lines and Vertical Angles
Pupils identify and define intersecting lines and vertical angles. They draw two intersecting lines and measure one pair of vertical angles. Learners will also move a line to change the angles of a figure and describe the changes in the...
Curated OER
Lines
In this Algebra I/Algebra II worksheet, students determine the slope of a line, write the equation of a line, examine parallel and perpendicular lines, and solve problems involving linear relationships. The two page worksheet contains...
Curated OER
Perpendicular Bisector of a Line Segment
High Schoolers investigate the perpendicular bisector of a line segment. They use Cabri Jr. to construct the perpendicular bisector of a segment. The dynamics capabilities of Cabri Jr. allow your learners to observe the lengths of the...
Curated OER
Graph Linear Inequalities
In this algebra worksheet, students solve linear inequalities and graph their results on a coordinate plane. They shade the correct side of the line. There are 8 questions with an answer key.
Curated OER
Pictures, Graphs and Diagrams
In this algebra worksheet, students define vocabulary related to circles, and other conics. They graph hyperbolas and eclipse. There are 20 questions.
Curated OER
Solving Systems by Graphing
Solve systems of equations with your super smart upper graders. They solve systems of equations and then graph two lines to find where they intersect. The focus on the activity is to have learners explore moving a point to illustrate...
Curated OER
Pyramid Activity
Pupils explore the concept of pyramids. They determine if two sides of a pyramid are perpendicular using a graphing calculator, then discuss parallel and perpendicular lines and how to determine if two lines are parallel or...
Curated OER
Implicit Differentiation
Pupils explore the concept of derivatives. They use implicit differentiation to determine points on a graph where a tangent line is horizontal, vertical, or oblique. Finally, learners find the derivative of a polynomial by...
Curated OER
Parabolas
Learn how to evaluate the derivatives of polynomials. Mathematicians find the derivative of a quadratic function and determine the value at a given value. Students compare the slope of the secant line through two points with the...
Curated OER
Equations of Lines Perpendicular and Parallel
In this algebra worksheet, students solve linear equations using one and two steps. They solve systems of equations using substitution and elimination with graphing. There are links for ready made tests and quizzes.
Curated OER
Scatter Diagrams and Curve Fitting
In this Scatter Diagrams and Curve Fitting worksheet, learners are guided in how to graph a scatter diagram (plot) and a Best Fit Line using a TI-83 graphing calculator.
Curated OER
Bisphenol A and Diabetes
Pupils summarize the data that is displayed and examine how bisphenol A behaves and how it contributes to diabetes. Learners also study an article and interpret line graphs.
Curated OER
Probability: The Study of Chance
Students conduct an experiment, determine if a game is fair, and collect data. They interpret data, then display line graph. They conduct analysis of game for probability.
Curated OER
Modeling Linear Relationships
Young scholars graph lines using the slope and y-intercept. In this algebra lesson, students create data using tables and equations. They use their data to make predictions and draw conclusion.
Curated OER
Growing a Seed
Seeing how seeds grow into plants is such an enjoyable for students! They plant lima bean seeds and take pictures to record the growth of their plants. Students write in a journal to describe their daily observations of their plants, and...
Curated OER
Greenhouse Effect ...Building Our Own
Students explore the greenhouse effect. They set up a simplified model of the earth and the greenhouse effect. Students compare temperatures inside a jar to temperatures outside the jar. Pupils collect information and create a line...
Other popular searches
- Line Graphs
- Double Line Graphs
- Bar and Line Graphs
- Line Pie Bar Graph
- Interpreting Line Graphs
- Line Plot Graphs
- Making Line Graphs
- Reading Line Graphs
- Analyzing Line Graphs
- Creating Line Graphs
- Number Line Graphs
- Reading Double Line Graphs


