EngageNY
Describing Center, Variability, and Shape of a Data Distribution from a Graphical Representation
What is the typical length of a yellow perch? Pupils analyze a histogram of lengths for a sample of yellow perch from the Great Lakes. They determine which measures of center and variability are best to use based upon the shape of the...
Curated OER
Practice Dividing by 6
In this dividing by 6 learning exercise, students use the table for the 'Great Lake State Photographs' to help them learn to divide by 6 and solve the six word problems.
EngageNY
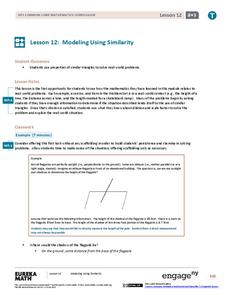
Modeling Using Similarity
How do you find the lengths of items that cannot be directly measured? The 13th installment in a series of 16 has pupils use the similarity content learned in an earlier resource to solve real-world problems. Class members determine...
Curated OER
Significant Figures
For this significant figures worksheet, students read about how to determine the number of significant figures and how to solve problems using significant figures. Then students complete 12 problems.
Curated OER
Compare Numbers Homework 2.1
In this comparing numbers activity, students use the <, > or = signs to compare two and three digit numbers. There are also 6 problems comparing a number and an addition problem. Example: 40+6 and 64.
Curated OER
The Trivia Magic Square
For this trivia magic square worksheet, students fill in the magic square from given clues. This one-page worksheet contains a five by five square. The answer is provided.
Other popular searches
- Great Lakes Worksheet
- Great Lakes Biodiversity
- Great Lakes Map
- Label the Great Lakes
- Maps of Great Lakes
- The Great Lakes
- Michigan's Great Lakes
- Five Great Lakes
- Great Lakes Region
- Great Lakes Lesson Plans
- Traveling the Great Lakes
- Activities the Great Lakes


