Curated OER
Graphing the Forecast - Line Graph or Bar Graph?
Sixth graders compare and contrast bar and line graphs. Using a weather forecast of the area, 6th graders record the high and low temperatures in a table. Students determine and justify the most appropriate graph to display a given set...
Curated OER
A Contouring We Go
Students examine the built environment and infrastructures of their community by constructing contour equipment, using the equipment, and comparing their results to current topographical maps of the same area
Curated OER
Data Analysis
Young statisticians use and interpret measures of center and spread such as mean, median, and mode as well as range. They use box plots to represent their data and answer questions regarding the correspondence between data sets and the...
Curated OER
Explorations 5: Introduction to Limits
In this limit worksheet, students find the interval values of given functions. They identify constants, and plot graphs. This three-page worksheet contains approximately 20 problems.
Curated OER
How Many Frogs?
Students explore the concept of linear regression. In this linear regression instructional activity, students find the line of best fit for a set of data pertaining to a frog population. Students use their line of best fit to predict the...
Curated OER
Many Ways to Represent Our Data
Demonstrate several ways to represent data with your class. They will use surveys to gather data and display the data using tally charts and graphs. Then answer questions according to the data.
Curated OER
Build a Bar Graph
Learners discover how to use bar graphs. They will gather and organize specific data in order to put it into a bar graph. Then they will answer several questions based on the information they have graphed.
Pennsylvania Department of Education
Volume and Surface Area
Build boxes using unit cubes to compare surface area and volume. The group performs multiple experiments to determine properties of volume, such as if it makes a difference which order the dimensions are multiplied in. Extensive...
Curated OER
Lesson #46: Bar Graphs and Line Graphs
In this bar graphs and line graphs worksheet, students interpret bar graphs, line graphs, and box-and-whisker plots. They find the measures of central tendency. This three-page worksheet contains notes, vocabulary, and...
Curated OER
Lesson 9-3 Practice A: Composite Figures
In this composite figures worksheet, learners solve twelve short answer problems. Students find the area of figures composed of various polygons given a sketch of the figure with side lengths labeled.
NY Learns
Investigation - Looking at Polygons
Middle schoolers construct polygons by plotting points on a coordinate plane. Pupils connect the points and identify which polygons they have drawn. They will need graph paper to carry out the assigned activities. A vocabulary list,...
Curated OER
Multiplication Strategies - A Day at the Zoo
This is an amazing 33-page resource for teaching multiplication! Your mathematicians will discover the connection between multiplication and repeated addition. They also will work collaboratively with arrays while studying zoo animals....
Curated OER
Multiplication Mania
A very nice presentation that serves as a quiz on multiplication facts. First, 3rd graders must answer 16 problems that appear on the screen on a sheet of paper. Then, they are given numbers, and must write the multiples needed to arrive...
Curated OER
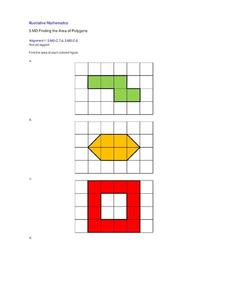
Finding the Area of Polygons
Third graders are exposed to finding the area of polygons by decomposing figures and recomposing them into rectangles. This strategy allows children to expand on their prior knowledge of constructing shapes by rearranging parts into...
Shodor Education Foundation
Pythagorean Theorem
Most adults remember learning about the Pythagorean theorem, but they don't all remember how to use it. The emphasis here is on developing an intuitive understanding of how and when to use the theorem. Young mathematicians explore...
Curated OER
Proofs of the Pythagorean Theorem
Working individually and collaboratively, geometers gain a clear understanding of the Pythagorean theorem. They create, explain, and compare proofs of the theorem. Proofs involve areas of trapezoids, squares, and triangles, congruent...
Bytes Arithmetic
Geometry Pad+
Graphing paper, pencil, ruler, protractor, and compass, all get replaced or supplemented with this dynamic geometry application. Here, you can create, move, and scale many different shapes, as well as, explore and change their properties...
Curated OER
Spinners and Fractions
Your learners create their own spinner using different colors and analyze the likelihood of landing on certain colors. The solutions are presented as fractions.
Curated OER
Latitude
Your young geologists generate a graph given a table of values from the context of latitude and percent of the earth's surface north of that latitude. The questions in the activity then focus the learners to a deeper understanding of the...
Curated OER
Geometry Project
Proofs are usually an intimidating assignment. An engaging lesson focused on geometric proofs may reduce the anxiety! Pupils choose between several triangle proofs to complete and work on completing them. The...
Mathed Up!
Angles
What does a geometric farmer drive? A protractor, of course! A set of assessment worksheets prompts learners to use a protractor as they measure angles, name angles, and identify lines. Use the video as a way to...
Achieve
Stairway
It's the stairway to learning! Scholars research all aspects of building a staircase. Using information from building codes, they write and graph a system of inequalities to analyze the constraints. The completed project is a scale model...
Mathematics Assessment Project
Printing Tickets
That's the ticket! Pupils write and investigate two linear functions representing the cost of printing tickets. Individuals then determine which of two printing companies would be a better buy.
Mathed Up!
Rotation
Two videos show first how to perform a rotation, given the center, the angle, and the direction of rotations. Individuals then see how to find what the rotation is from one figure to another. Pupils practice doing both in seven problems...
Other popular searches
- Math Grid
- Math Grid Puzzles
- Math Grid Art
- Math Grid Drawings
- Math Grid Coordinates
- Math Grid Paper
- Math Missing Number Grid
- 48 Math Grid
- Diamond Math Grid
- Math Grid Drawings
- Thanksgiving Math Grid
- Halloween Math Grid


