Curated OER
Vacation Values: A Math WebQuest
Fifth graders participate in a Math Web Quest to research two vacation options for their "families" in order to determine the best mathematical value for their family. They gather data, create two comparison graphs based on that data,...
Curated OER
"Eggs-ploring" Math with Jellybeans
Learners work in pairs with a small bag of jellybeans to estimate the number of candies in their bags and then figure out how many groups of 10 jellybeans are contained in their bags. They then graph the information using a pictograph or...
Curated OER
Using a Number Line: 5th Grade Math
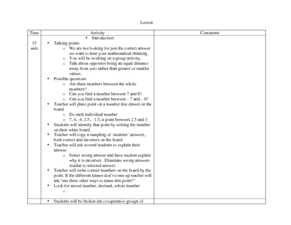
Working in groups, the class will use what they know about whole number operations to solve a real-world problem involving a number line. They will focus on using the number line to correctly label the placement of whole numbers,...
Virginia Department of Education
Measuring Mania
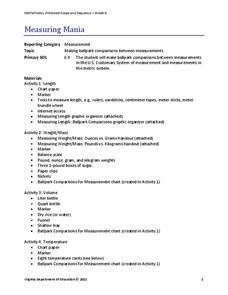
Conversion immersion — it's measuring mania! A set of four activities teaches scholars to convert between customary and metric units. Resource covers unit conversions in length, temperature, weight/mass, and volume.
Curated OER
School Activities
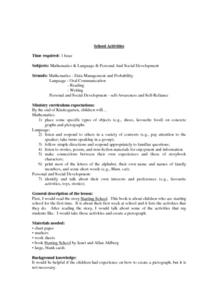
First graders place some specific types of objects (e.g., shoes, favorite food) on concrete graphs and pictographs. They listen and respond to others in a variety of contexts (e.g., pay attention to the speaker; take turns speaking in a...
Noyce Foundation
Granny’s Balloon Trip
Take flight with a fun activity focused on graphing data on a coordinate plane. As learners study the data for Granny's hot-air balloon trip, including the time of day and the distance of the balloon from the ground, they practice...
Space Awareness
What is Time?
Does it ever seem like time is slipping through your fingers? Model the passing of time with an hourglass activity in which individuals determine whether hourglasses are the most efficient way to measure time.
Have Fun Teaching
Earth Day Number Practice 0-20
How many trees can your pupils plant? Practice numbers 0-20 with several related activities. For the first, kids match images of trees to numbers. They then match the number symbols to number words, using a word bank. The final activity...
PBS
The Lowdown — Rot and Rubbish: The Rancid Truth about How Much Food We Waste
Compare waste a percent at a time. The resource contains an infographic on food waste. Using images, the informative activity describes the amount and types of food waste that occur. Pupils compare the percentage of waste from their...
Balanced Assessment
Classroom Groups
How many different ways can a teacher organize a class into groups? In a grouping activity, learners explore the number of possible combinations of groups given different total participants and size criteria. They then make...
Curated OER
Problem Solving: Division
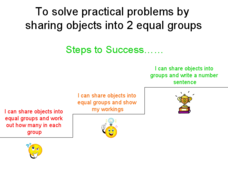
A cute zoo theme sets the tone for a problem-solving activity which primes early learners for division. They separate zoo animals into equal groups and then write an equation that expresses the action.
EduGAINs
Discovery of Pi
Serve up a slice of math for Pi Day! A combination of fun, hands-on lessons and helpful worksheets encourage learners to practice finding the radius, diameter, and circumference of different circles.
Illustrative Mathematics
Sort and Count
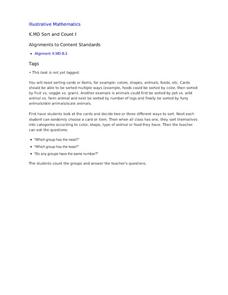
Young mathematicians are on their feet and moving around in this primary grade sorting activity. After giving each child an object or picture card, they then sort themselves into groups, counting to see which has the most or least...
EngageNY
Piecewise and Step Functions in Context
Looking for an application for step functions? This activity uses real data to examine piecewise step functions. Groups create a list of data from varying scenarios and create a model to use to make recommendations to increase...
Curated OER
Measuring our Hands!
How do we compare? Get your scholars measuring using this interactive and kinesthetic math activity. First, learners compare something (you announce- could be index finger, palm, feet, etc.) to classmates. Consider having them record...
Florida Center for Instructional Technology
Two for One Box Company
Given a box of certain dimensions, young mathematicians must determine if a box that is twice as big, actually holds twice as much. This is a brain-teaser of a problem. The worksheet provides a handy table that has learners calculate the...
US Department of Commerce
Make Data Speak
Data displays are more than just a bunch of numbers. Small groups access census results and create eye-catching data displays. Teams choose a statistic and collect data points for five locations. Classmates present their infographics to...
EngageNY
Analyzing a Data Set
Through discussions and journaling, classmates determine methods to associate types of functions with data presented in a table. Small groups then work with examples and exercises to refine their methods and find functions that work...
Education Development Center
Logic of Fractions
Before diving into operations with fractions, learners discover the foundation of fractions and how they interact with one another. Exactly as the title says, logic of fractions is the main goal of a resource that shows pupils how...
Curriculum Corner
Learning Fun with Hershey Bars
Compiled of 18 task cards and five worksheets, young mathemmaticians practice solving fraction word problems and other fraction-based activities with a Hershey Bar. The packet comes with sheets to record and keep track of all of the task...
Virginia Department of Education
Probability
Classes explore different scenarios using manipulatives to learn about the difference between independent and dependent probability. Learners experiment with colored chips to model the two types of probabilities. To test their...
Radford University
Survey Activity
It's time to take a survey. After looking at an example of a survey on lunch preferences, groups design their own surveys. They consider the sample size and sampling technique, then conduct the surveys. As a final activity, they create...
Radford University
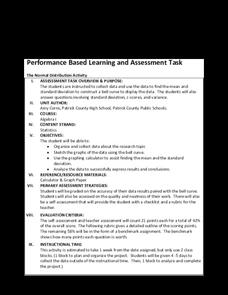
The Normal Distribution Activity
For whom does the bell fit? Pupils begin by working in groups gather data on three different variables. They then determine the mean and standard deviation of each data set and create bell curves. To finish, they answer guiding questions...
Radford University
Connecting Scatter Plots and Correlation Coefficients Activity
Collect a variety of bivariate data. Groups determine sets of data that would provide a positive, negative, and no correlation. Team members gather their data through out the week. Scholars plot the data and determine the relationship...


