EngageNY
Graphing the Logarithmic Function
Teach collaboration and communication skills in addition to graphing logarithmic functions. Scholars in different groups graph different logarithmic functions by hand using provided coordinate points. These graphs provide the basis for...
EngageNY
Why Do Banks Pay YOU to Provide Their Services?
How does a bank make money? That is the question at the based of a lesson plan that explores the methods banks use to calculate interest. Groups compare the linear simple interest pattern with the exponential compound interest pattern.
Rational Number Project
Initial Fraction Ideas Lesson 9 Overview
Visual models support young mathematicians with exploring equivalent fractions. Starting with a quick warm-up problem, children go on to work through a series of guiding practice problems before working with a partner identifying and...
EngageNY
Estimating Centers and Interpreting the Mean as a Balance Point
How do you balance a set of data? Using a ruler and some coins, learners determine whether the balance point is always in the middle. Through class and small group discussions, they find that the mean is the the best estimate of the...
EngageNY
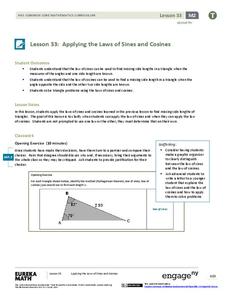
Applying the Laws of Sines and Cosines
Breaking the law in math doesn't get you jail time, but it does get you a wrong answer! After developing the Law of Sines and Cosines in lesson 33 of 36, the resource asks learners to apply the laws to different situations. Pupils must...
EngageNY
Putting It All Together
Shuffle 'em up and deal! Learners practice operations with polynomials using cards they pass around the room. The activity works with pairs or individuals, so it offers great flexibility. This is the fifth installment in a series of 42...
Bowland
Fashionista
So trendy! Show your class how to identify trends in sales patterns using mathematics. Scholars use a software simulation to collect data on age groups, price, and sales at a fashion store. This data allows individuals to determine the...
EngageNY
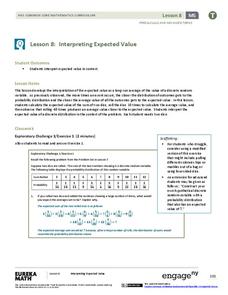
Interpreting Expected Value
Investigate expected value as a long-run average. The eighth installment of a 21-part module has scholars rolling pairs of dice to determine the average sum. They find aggregate data by working in groups and interpret expected value as...
Illustrative Mathematics
Measure Me!
How many unifix cubes tall are you? If you're not sure, then perform this math activity with your class and find out. Working in pairs, young mathematicians make measuring sticks out of unifix cubes in order to determine the length of...
EngageNY
Mastering Factoring
Math class is full of drama—there are so many problems to work out! Pupils work out factoring problems. They use quadratic methods of factoring higher degree polynomials, in addition to factoring the sum and difference of two cubes.
Mathematics Assessment Project
Deducting Relationships: Floodlight Shadows
Try to figure out what happens with shadows as a person moves between two light sources. A formative assessment lesson has individuals work on an assessment task based on similar triangles, then groups them based on their assessment...
EngageNY
The Volume Formula of a Pyramid and Cone
Our teacher told us the formula had one-third, but why? Using manipulatives, classmates try to explain the volume formula for a pyramid. After constructing a cube with six congruent pyramids, pupils use scaling principles from previous...
EngageNY
Why Are Vectors Useful? 1
How do vectors help make problem solving more efficient? Math scholars use vectors to represent different phenomenon and calculate resultant vectors to answer questions. Problems vary from modeling airplane motion to the path of a robot.
Education Closet
Equal Rhythms
Engage young mathematicians in learning about fractions with this cross-curricular math and music lesson. After listening to and repeating different beat patterns, children realize that musical notes are just another way of representing...
EngageNY
A Surprising Boost from Geometry
Working with imaginary numbers — this is where it gets complex! After exploring the graph of complex numbers, learners simplify them using addition, subtraction, and multiplication.
EngageNY
Logarithms—How Many Digits Do You Need?
Forget your ID number? Your pupils learn to use logarithms to determine the number of digits or characters necessary to create individual ID numbers for all members of a group.
EngageNY
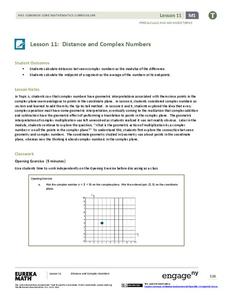
Distance and Complex Numbers 1
To work through the complexity of coordinate geometry pupils make the connection between the coordinate plane and the complex plane as they plot complex numbers in the 11th part of a series of 32. Making the connection between the two...
EngageNY
When Can We Reverse a Transformation? 2
The second lesson on finding inverse matrices asks class members to look for a pattern in the inverse matrix and test it to see if it works for all matrices. The teacher leads a discussion to refine the process in finding inverses, then...
EngageNY
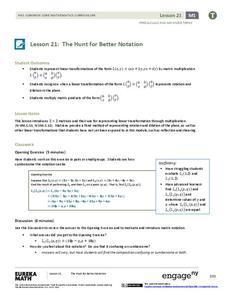
The Hunt for Better Notation
The matrix — it's not just a movie. The lesson introduces the concept of 2 x 2 matrix multiplication as a way to represent linear transformations. Class members determine when a linear transformation represented as matrix multiplication...
EngageNY
An Area Formula for Triangles
Use a triangle area formula that works when the height is unknown. The eighth installment in a 16-part series on trigonometry revisits the trigonometric triangle area formula that previously was shown to work with the acute triangles....
Illustrative Mathematics
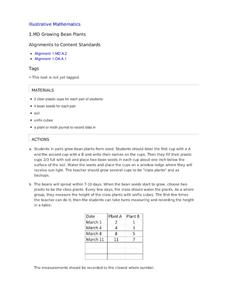
Growing Bean Plants
Plant growth experiments offer rich, cross-curricular learning opportunities that can really excite and engage young learners. In this series, children work in pairs planting, measuring, and comparing the height of bean plants in order...
EngageNY
More on Modeling Relationships with a Line
How do you create a residual plot? Work as a class and in small groups through the activity in order to learn how to build a residual plot. The activity builds upon previous learning on calculating residuals and serves as a precursor to...
EngageNY
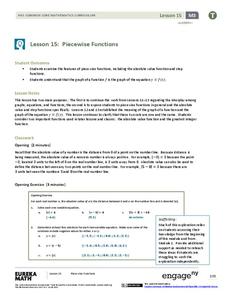
Piecewise Functions
Show your class members that if they can graph a linear function, they can graph an absolute value function. Groups create an absolute value graph using a table, then entertain the idea of an absolute value function defined as two pieces...
Bowland
Mystery Tours – Plan Your Tour
Everyone loves a vacation and a set of three activities has groups planning a tour of the U.K. using given distance, time, and price data. They solve a variety of problems related to the trip and produce a report on the success of the trip.


