Curated OER
Visualizing Skip Counting by 2
Drawing pictures to solve math problems is not only a good problem solving strategy, it's also mathematical modeling. First graders read six basic word problems that have them skip count by twos to find the answer. They draw pictures in...
EngageNY
Modeling a Context from a Verbal Description (part 1)
When complicated algebraic expressions are involved, it is sometimes easier to use a table or graph to model a context. The exercises in this lesson are designed for business applications and require complex algebraic...
Coloring Squared
Memorial Day Soldiers
Practice division and celebrate Memorial Day with a color-by-number problem solving worksheet. The final picture includes a group of Memorial Day soldiers.
Curated OER
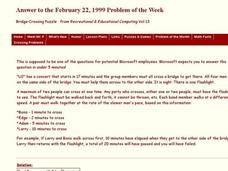
Bridge-Crossing Puzzle
For this bridge-crossing worksheet, learners read a word problem. They use logic and deductive reasoning to determine the correct combination for two men to cross a bridge at the same time to get the anticipated results. This...
Balanced Assessment
Confetti Crush
In the first part of a middle school assessment task, learners analyze a given statement about the amount of confetti revelers throw at Times Square on New Year's Eve. The second part of the task requires learners to identify objects...
Mathed Up!
Using a Calculator
Here's a video that presents several numerical expressions to be evaluated using a calculator.Viewers come to realize that sometimes it is not just a matter of punching in the numbers, but they also need to be concerned about how...
Illustrative Mathematics
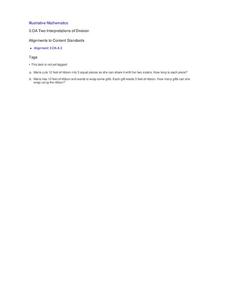
Two Interpretations of Division
Division can be seen in two ways; as splitting a whole into a certain number of pieces, or splitting it into pieces of a certain size. Help your class reach this understanding with these two simple word problems. Encourage the use of...
Education Development Center
Geography of the Coordinate Plane
Put the graph into graphing and allow learners to understand the concept of point plotting and how it relates to data. The worksheet provides a nice way to connect data analysis to a graph and make predictions. The worksheets within...
Illustrative Mathematics
Foxes and Rabbits 3
Model periodic populations. Here, in the context of foxes and rabbits, pupils look at graphs of the populations of these animals in a national park over a span of 24 months. Groups analyze the graphs and determine trigonometric...
Mathed Up!
Area of Compound Shapes
Scholars learn how to determine the area of compound shapes by finding the areas of the basic shapes that make it up. Pupils find the areas by adding areas together or subtracting them.
Curated OER
Identify More
In this early childhood size comparison activity activity, students examine 6 boxes with 2 groupings of objects and circle the grouping in each box that has more items than the other grouping.
Curated OER
Base Ten Blocks Rods and Flats (A)
Using visual cues and hands on manipulatives are great for conveying concepts in a concrete way. Learners are given a set of rods, they break the set up into flats, then count the rods left over to determine an answer. There are 5...
Math Worksheets Land
Add and Subtract Multi-Digit Whole Numbers
Help young mathematicians see the value in addition and subtraction. Offering one addition and one subtraction problem, this worksheet walks students step-by-step through the solutions of each, starting in the ones place and working...
Mathed Up!
3-D Pythagoras
Apply the Pythagorean Theorem in three-dimensional shapes. Young mathematicians watch a video that takes them through several examples of using the Pythagorean Theorem to solve problems involving lengths in three-dimensional figures. A...
Curated OER
Fifty Members of a Group: Average
In this average worksheet, students solve 1 word problem. Students find the average age of 47 people given the average of 50 people and three people's ages who leave the group.
Curated OER
Counting Groups of Ten 1
In this counting sets of ten worksheet, learners count groups of ten, write the two-digit numbers, and add the extra units. Students solve 9 problems.
Curated OER
Using Math to Get to the Source
In this lead blood levels worksheet, students use mathematics to determine the source of lead poisoning in children. They are given data, they analyze the data and they graph the blood level measurements vs. the mean blood lead level in...
Curated OER
Add Groups of Ten
In this addition worksheet, learners add groups of tens and their remainders to determine the missing addends in the pairs of 2-digit problems and then find the sums. Students solve nine problems.
Curated OER
Fractions of a Group
In this writing fractions word problem worksheet, students read information and write the fractional parts to problem solve. Students solve six problems.
Curated OER
Tic-Tac-Toe Math
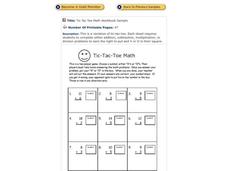
In this addition worksheet, students pair up in twos and work through the addition problems, then put a 'x' or an 'o' in their box. The student that gets their symbol in a row, wins.
Curated OER
Fractional Parts of a Group
In this finding fractional parts word problem learning exercise, students draw and color to problem solve. Students solve six problems.
Curated OER
Fractional Parts of a Group
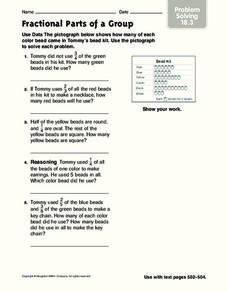
In this problem solving worksheet, students problems solve the answers to 5 mathematical word problems involving fractional parts. Students use data from a pictograph to assist them in solving each word problem.
Curated OER
Math Challenge: Count Coins
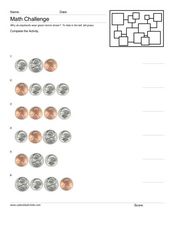
In this counting change worksheet, students count the values of pennies, nickels, and dimes to determine the total amount of each group of coins. Students solve 6 problems.
Curated OER
Worksheet 3 Math 126: Ellipses and Hyperbolas
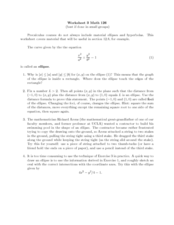
In this ellipses and hyperbolas instructional activity, high schoolers solve 8 short answer and graphing problems. Students graph ellipses, hyperbolas, and parabolas given an equation. High schoolers identify the foci of an ellipse or...


