Fluence Learning
Writing an Argument: Innovation in America
Are American young people prepared to become tomorrow's leaders in technological innovation, or does an obsession with being cool sidetrack essential skills? That is the question freshmen and sophomores must address in a performance...
EngageNY
Tax, Commissions, Fees, and Other Real-World Percent Problems
Pupils work several real-world problems that use percents in the 11th portion of a 20-part series. The problems contain percents involved with taxes, commissions, discounts, tips, fees, and interest. Scholars use the equations formed for...
Charleston School District
Contextualizing Function Qualities
Let the graph tell the story! Adding context to graphs allows learners to analyze the key features of the function. They make conclusions about the situation based on the areas the graph is increasing, decreasing, or has a maximum...
Curated OER
Division with Equal Grouping
Young math wizards solve two story problems in which simple division (with leftovers) is used. They draw pictures or write to explain their answers.
Curated OER
How Many Fish in the Pond?
How many fish are in Mills Pond? Learners examine an image with 17 fish. There are four types of fish, each of which is displayed on a data chart. Focus on collecting data and counting as scholars record the number of each type in its...
Statistics Education Web
First Day Statistics Activity—Grouping Qualitative Data
Making groups of groups can help to organize data. Classes use statistics to group themselves using descriptive adjectives. The objective is for learners to understand that grouping qualitative data is useful when the original groups are...
EngageNY
Comparing Estimated Probabilities to Probabilities Predicted by a Model
Small groups devise a plan to find the bag that contains the larger percentage of blue chips. they then institute their plans and compare results to the actual quantities in the bags.
Henrico County Public Schools
Factoring
Need a way to keep your mathematicians interacting while factoring quadratics? This worksheet relies on group interaction to correct and proceed with multiple factoring problems. Individuals sign their name when they...
EngageNY
Why Worry About Sampling Variability?
Are the means the same or not? Groups create samples from a bag of numbers and calculate the sample means. Using the sample means as an estimate for the population mean, scholars try to determine whether the difference is real or not.
EngageNY
Random Sampling
Sample pennies to gain an understanding of their ages. The 16th installment of a 25-part series requires groups to collect samples from a jar of pennies. Pupils compare the distribution of their samples with the distribution of the...
Center for Innovation in Mathematics Teaching
Unit 8 Section 2: Linear Equations with Brackets
Math whizzes read through three examples on solving linear equations and then work online through three practice problems. For the practice questions, they can click on "Show me. . . " to see the solution. A total of 26 linear equation...
EngageNY
Solving Problems by Finding Equivalent Ratios II
Changing ratios make for interesting problems. Pupils solve problems that involve ratios between two quantities that change. Groups use tape diagrams to represent and solve classroom exercises and share their solutions.
EngageNY
Real-World Positive and Negative Numbers and Zero II
Continuing from the previous lesson plan in the series, scholars learn to use positive and negative integers to describe real-world situations. In groups, they come up with their own situations for given positive and negative...
EngageNY
Comparison Shopping—Unit Price and Related Measurement Conversions
Speed up your scholars' understanding of ratios. Class members compare ratios related with speeds presented in different representations. They then use the unit rates to make the comparisons.
Curated OER
Third Grade Math
In this math worksheet, 3rd graders complete multiple choice questions about fractions, evens and odds, decimals, and more. Students complete 20 questions.
EngageNY
Mid-Module Assessment Task: Grade 8 Module 2
It's time for a concept check! Check for student understanding over the three types of rigid transformations. The assessment follows the first 10 lessons in this series and to test pupils' proficiency of these concepts. Individuals...
EngageNY
Mid-Module Assessment Task: Grade 7 Mathematics Module 3
Lesson 16 in the series of 28 is a mid-module assessment. Learners simplify expressions, write and solve equations, and write and solve inequalities. Most questions begin as word problems adding a critical thinking component to the...
EngageNY
End-of-Module Assessment Task: Grade 7 Mathematics Module 6
Determine the level of understanding within your classes using a summative assessment. As the final lesson in a 29-part module, the goal is to assess the topics addressed during the unit. Concepts range from linear angle relationships,...
EngageNY
End-of-Module Assessment Task: Grade 8 Module 1
It's all in the numbers. Determine your pupils' level of understanding of scientific notation using this assessment task. The final lesson in the series assesses scholars on the application of scientific notation in real-life...
Curated OER
Math Fun with Animals
In this equation worksheet, learners solve the problem, then they draw an arrow to the right answer in the heart. The worksheet provides eight equations for the students to practice.
HHS Math
Group Worksheet 1F - Graphing and Finding Zero
Graph quadratic functions and find the zero in this learning exercise. Twelve problems range from those that could be quickly factored and graphed, to those that require use of the quadratic formula and their graphs approximated....
EngageNY
Using Sample Data to Compare the Means of Two or More Populations II
The 23rd segment in a series of 25 presents random samples from two populations to determine whether there is a difference. Groups determine whether they believe there is a difference between the two populations and later use an...
Curated OER
Human Population- Changes in Survival Rates Data Interpretation
In this human population changes in survival worksheet, students interpret and plot data to understand the differences in human mortality and survivorship between historic and modern times. They investigate how these changes influence...
Ohio Department of Education
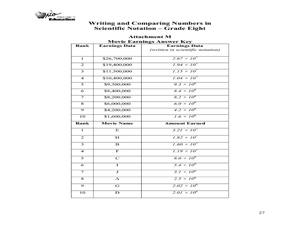
Writing and Comparing Numbers in Scientific Notation-Grade Eight
Explore scientific notation in this mathematics lesson. Young mathematicians explore multiple representations of large number in scientific notation through the use of models, visual representation and expanded form. The lesson provided...


