Radford University
Percentages: Lesson 1
Math can be taxing at times. With a short lesson, pupils determine how income tax affects take-home pay. Learners determine their net pay based on tax tables and how adjustments in their gross pay changes the paycheck.
Radford University
What is My Standing Height Wise?
Given a scenario in which a class member wants to prove his height is not an outlier, pairs devise a plan and gather evidence to help support his claim. The small groups implement their plans and create graphical displays of their data...
Curated OER
How Many Noses Are in Your Arm?
Middle schoolers apply concept of ratio and proportion to determine length of Statue of Liberty's torch-bearing arm. They view video of Statue of Liberty, determine how long statue's arm would be if its nose measures four feet six...
Scholastic
Missing Bone
It's fun being odd! Have kids find their way through a paw print maze by connecting odd numbers in any direction, eventually connecting to a cute dog's bone in the middle of the puzzle.
Lincoln Public Schools
Cereal Box Project
Challenge your class with this fun and engaging engineering design project. The goal, to create a brand new cereal complete with a list of ingredients, a name and logo, and a box to hold it in. Starting with a survey to determine the...
Curated OER
Chain Connection and Un-Connection Activity
Learners practice remaining on topic during a conversation using printouts of chains as visual models for their work. Chains are placed in sequence while students stay on a shared topic of conversation, and a broken chain is used as...
Curated OER
Problem Solvers
Fifth and sixth graders compare decimals to the place-value structure in the base-ten number system. They represent fractions as parts of unit wholes, as parts of a set, as locations on a number line, and as divisions of whole numbers....
Curated OER
Math: Real Time and Live
Get an interdisciplinary edge. Scholars study air contamination and slope. They record the time it takes for air fresheners to reach them at variable distances. They document their times, classify them by distance, and draw a scatter...
Math Worksheets Land
Unknown Numbers in Sums and Differences
You've hit the word problem jackpot with this set of 10 addition and subtraction scenarios! For each, learners have to find a missing number. Sometimes it is the sum or difference, and for others, an addend or minuend. For each, there is...
Mt. San Antonio Collage
Test 1: Graphing Functions
Graph the night away with all the different types of functions provided in the worksheet. Linear, quadratic, and rational all ask for graphs, domain and range and other key factors about the functions.
101 Questions
Best Circle
Drawing the perfect circle is harder than one would think! What makes a circle a circle and how can you define that with a formula? Young mathematicians devise their own methods of analyzing the imperfections of circle drawings. Using...
PBS
Accessible Shapes
All the 2-D and 3-D measurement work you need is in one location. Divided into three sections, the geometry lesson plans consist of visualization of three dimensions, classifying geometric figures, and finding surface area and volume....
College Board
2002 AP® Statistics Free-Response Questions Form B
Develop a deeper understanding of statistics. The six released free-response items from the 2002 AP® Statistics Form B involve several concepts that are currently in the regular statistics standards. Teachers see how...
College Board
2007 AP® Statistics Free-Response Questions Form B
So that is how they do it! Pupils and teachers see how College Board assesses topics using the free-response questions from Form B of the 2007 AP® Statistics test. The six questions are divided in two sections, the first five being...
Radford University
Natural Disaster Recovery and Quadrilaterals: Trapezoids and Land Assessments
After a tornado, an insurance company is in need of finding the area of a plot of land. Pupils use their knowledge of trapezoids and area formulas to calculate the area of the plot of land. The scholars work in groups to justify the...
Radford University
The Wheels on the Bus
Find a cheaper way to keep buses going round and round. Small groups use their knowledge of ratios and proportions to find ways to save money on school transportation. The teams determine the number of miles buses currently travel by...
Radford University
How Tall Is It?
Find the height from afar. Teams role play as summer interns to find the height of a set of windows from the outside. Scholars must first determine how to find the height with the available tools. After determining a strategy involving...
Radford University
Action Bungee Jump
Drop scatter plots onto the class. Teams collect data to determine how far an action figure will fall suspended by rubber bands. Using the collected data, groups determine a line of best fit. Given a drop height, they also determine the...
Radford University
Snappy Stair Sprints
Let's go for a run. Small groups determine a way to collect data to determine the time it would take to run a set of stairs. After creating a plan, teams collect data and graph their results, calculating the equation of best fit and...
Radford University
Animal Decline
Where did they all go? Small groups collect data on different animal species that are on a decline. Teams develop equations to model the populations over time and then create presentations about the decline of their animals. Classmates...
Radford University
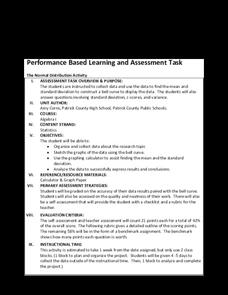
The Normal Distribution Activity
For whom does the bell fit? Pupils begin by working in groups gather data on three different variables. They then determine the mean and standard deviation of each data set and create bell curves. To finish, they answer guiding questions...
Arcademics
Swimming Otters
Otters swim through numerical gates carrying multiplication equations with a missing factor. By choosing the gate with the correct missing factor, players make the otter swim faster in the online game.
Curated OER
How Big is Big?
Geography learners compare and contrast population densities throughout the world. Using maps, they estimate the relative size of the world's regions and populations. They develop analogies to discover the world they live in and...
Digging Into Math
Classifying Triangles
Young mathematicians explore the world of three-sided shapes in this lesson plan on the different types of triangles. Starting with a general introduction to classification using Venn diagrams, children learn how to...


