EngageNY
Using Sample Data to Compare the Means of Two or More Populations II
The 23rd segment in a series of 25 presents random samples from two populations to determine whether there is a difference. Groups determine whether they believe there is a difference between the two populations and later use an...
Curated OER
Adventures in Statistics
Here is a fantastic lesson for your fifth grade math scholars. In it, learners must determine if the classrooms of upper graders are bigger, or smaller, than the classrooms of the lower grades. Some excellent worksheets are embedded in...
Curated OER
Human Population- Changes in Survival Rates Data Interpretation
In this human population changes in survival worksheet, students interpret and plot data to understand the differences in human mortality and survivorship between historic and modern times. They investigate how these changes influence...
Ohio Department of Education
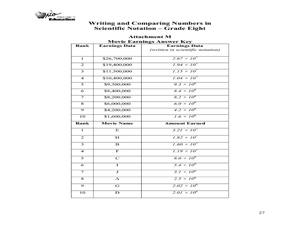
Writing and Comparing Numbers in Scientific Notation-Grade Eight
Explore scientific notation in this mathematics lesson. Young mathematicians explore multiple representations of large number in scientific notation through the use of models, visual representation and expanded form. The lesson provided...
Curated OER
What's in Your Piggy Bank?
Fill up your piggy banks! First graders find different ways to fill up cute piggy banks with 30 cents. Will they use two dimes and two nickels? Or a quarter and five pennies? Use this activity with groups to reinforce your money math...
Scholastic
Study Jams! Area of a Triangle
Even though there is a wide variety of different triangles in the world, knowing a single equation allows us to find the area of each and every one of them. Follow along with this step-by-step presentation as Zoe clearly models how to...
Inside Mathematics
Swimming Pool
Swimming is more fun with quantities. The short assessment task encompasses finding the volume of a trapezoidal prism using an understanding of quantities. Individuals make a connection to the rate of which the pool is filled with a...
CCSS Math Activities
Smarter Balanced Sample Items: 6th Grade Math – Target C
Are you looking for review questions before standardized testing? Grade 6 Claim 1 Item Slide Show offers nine questions covering a variety of topics using decimals, factors, and multiples. With separate slides for answers, using the...
Curated OER
Sea Turtle Math
Students consider the future of endangered species. In this conservation activity, students view a slide show and use mathematical data to construct a prediction for the survival of an endangered species. This activity includes, personal...
Curated OER
Estimate How Many Seeds Are In a Fruit or Vegetable
Help mathematicians estimate how many seeds are in a given vegetable or fruit. They are divided into pairs and estimate the amount of seeds in a whole fruit without seeing the inside. They then cut the fruit or vegetable in half and...
Curated OER
Put Your Truss in Building Bridges
Students apply abstract concepts, such as stress, fulcrums, the law of gravity, and the strength of different geometric shapes. Groups of student contractors operate simulated architectural firms to create strong, economical bridges.
Curated OER
Fractions in Action
Investigate equivalent fractions with your class. They compare and order fractions. Then they work cooperatively in groups to experiment and problem solve with fractions using a game format. Multiple resources are provided.
Curated OER
In Great Demand
Focusing on supply and demand, learners discuss economic principles in this lesson related to Wisconsin. After discussing supply and demand, learners answer questions related to a pizza parlor. They talk about profit, as well as other...
PBS
The Lowdown — U.S. Gun Homicides: Visualizing the Numbers
Is gun violence a big issue in America? Pupils explore gun deaths by type, race, and age group in a Math at the Core: Ratios interactive. The class tries to determine whether America is a safe place to live and use bar graphs and pie...
Education World
The African American Population in US History
How has the African American population changed over the years? Learners use charts, statistical data, and maps to see how populations in African American communities have changed since the 1860s. Activity modifications are included to...
Curated OER
Population Growth in Yeasts
Students design an investigation using yeast. In this environmental engineering lesson plan, students design an investigation to determine how environmental factors affect the growth of yeast. They will collect quantitative data and...
Curated OER
Tell Us All: Tools for Integrating Math and Engineering
What a scam! Middle and high schoolers pose as journalists exposing consumer fraud. In this lesson plan, they write an article for a magazine using data collected during previous investigations (prior lessons) to defend their findings...
Ohio Department of Education
Multiplying and Dividing in Scientific Notation - Grade 8
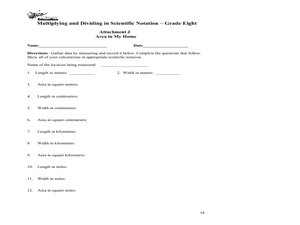
Here is really nice set of resources on scientific notation. Eighth and ninth graders explore the concept of multiplying and dividing in scientific notation. In this multiplying and dividing numbers in scientific notation...
Curated OER
What's in a Number? Analyzing Smoking Statistics
Sixth and seventh graders analyze smoking statistics. In this health lesson, learners look at the percentage of people who smoke from each race group. They create a bar graph and circle graph that displays this information.
Curated OER
Putting Numbers in Order, Numbers up to 100
Party with number balloons! Young learners study four groups of illustrated balloons with numbers on them, and write the numbers in sequence from smallest to greatest, or greatest to smallest. For extra fun, have them color the balloons...
Gatton Park
Magical Maths
A variety of activities take scholars outside the classroom to explore shapes, symmetry, measurement, patterns, sorting, and time in nature. Learners participate individually, and in teams, to measure found objects, go on a...
Charleston School District
Review Unit 1: Exponents
What will be on the test? The resource provides comprehensive review items for the content of the unit on exponents. The resource divides the sections in the order you present the lessons during the unit.
Kid Zone
Groundhog's Day Graphing
This Groundhog's Day, challenge scholars to predict, estimate, tally, and graph in a weather-themed lesson in which class members play the role of the groundhog to forecast the weather come February second.
Curated OER
Exploring Number and Operation in Secondary Mathematics
Young geometers need a clear understanding of perimeter, volume, and area. This lesson provides a worksheet to help small groups of learners to calculate various measurements of objects and choose the proper units for measurement. It...


