Shodor Education Foundation
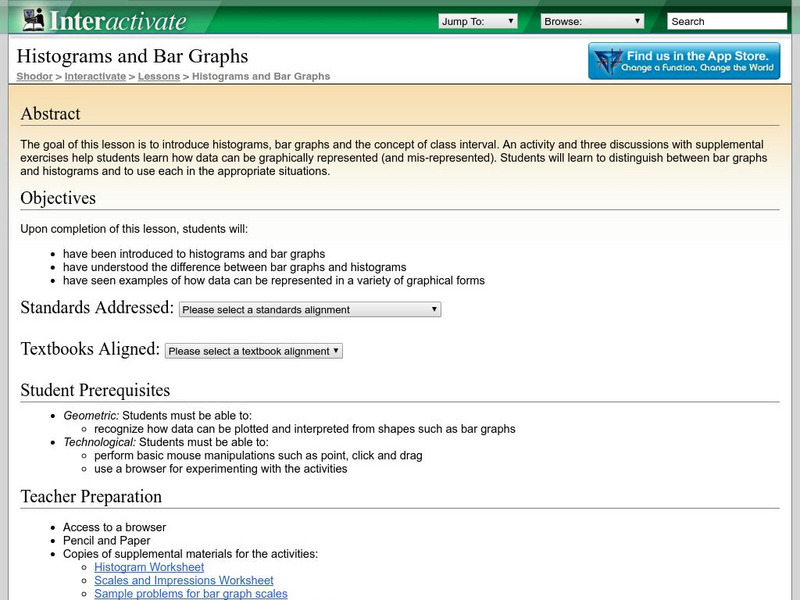
Shodor Interactivate: Lesson: Histograms and Bar Graphs
This site provides information on Histograms and Bar Graphs. It includes worksheets, key terms, and links to further information.
Texas Instruments
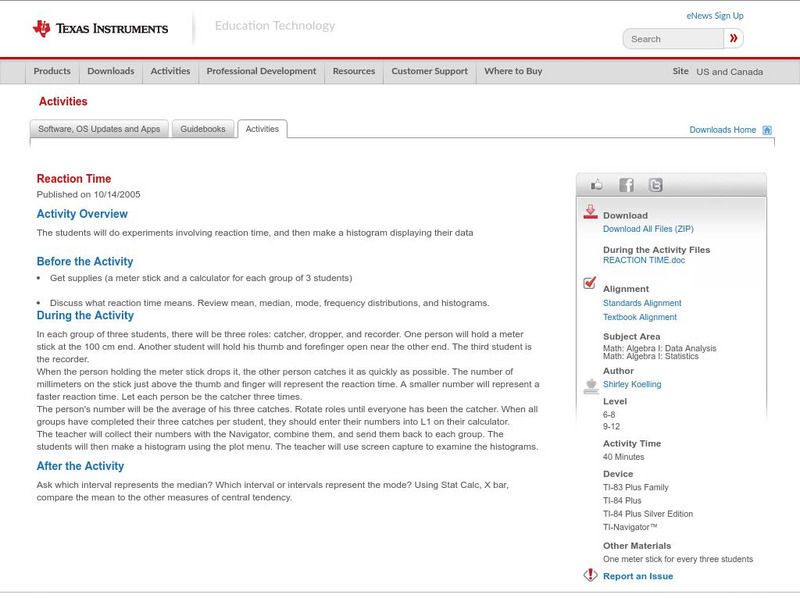
Texas Instruments: Reaction Time
The students will do experiments involving reaction time, and then make a histogram displaying their data.
Missouri State University
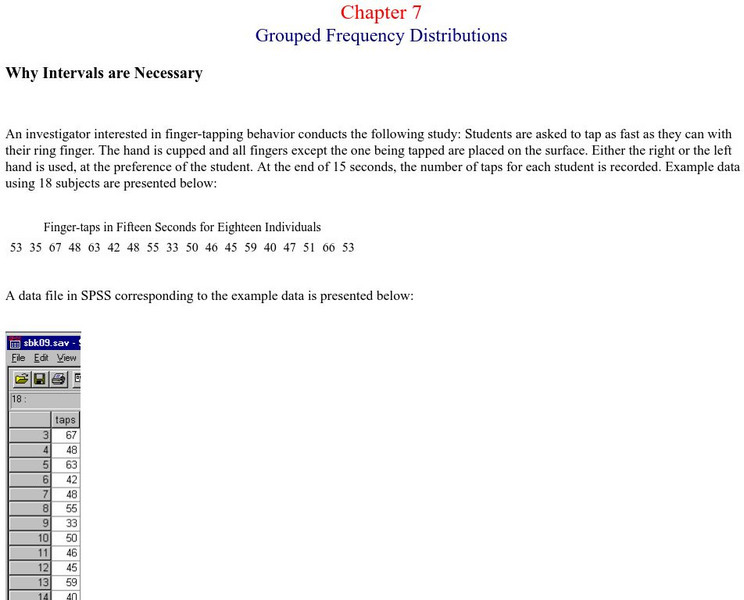
Missouri State Univ.: Introductory Statistics: Grouped Frequency Distributions
An example is provided for the explanation of grouped frequency distributions. Graphs show how to construct histograms and overlapping bell curves, and Excel documents are discussed as being useful here.
Richland Community College
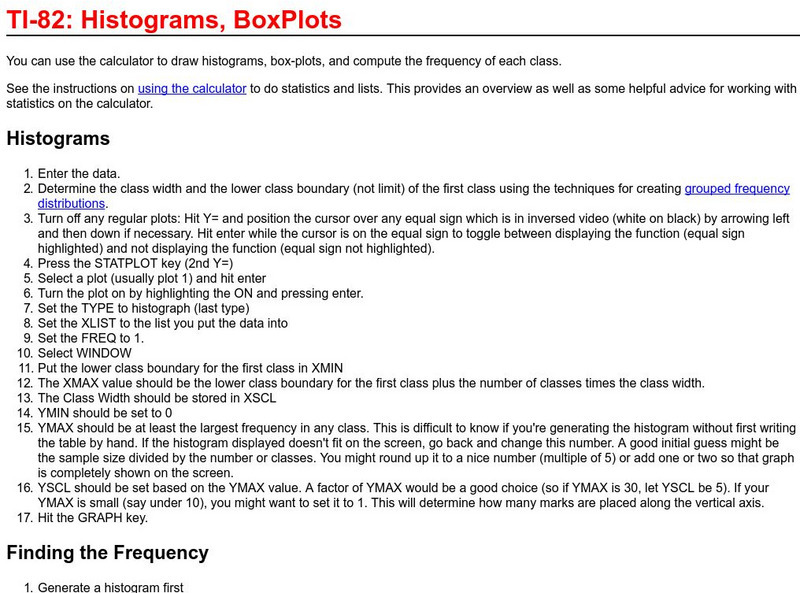
Richland College: Ti 82 Histograms / Box Plots
Richland College provides a step-by-step procedure on how to use a TI-82 to construct histograms and box plots and then use this to find frequency distribution.
Shodor Education Foundation
Shodor Interactivate: Normal Distribution
Change the standard deviation of an automatically generated normal distribution to create a new histogram. Observe how well the histogram fits the curve, and how areas under the curve correspond to the number of trials.
Texas Instruments
Texas Instruments: Numb3 Rs: No Desk Left Behind
Based off of the hit television show NUMB3RS, this lesson simulates a situation at a school, in which a principal is determining the number of desks needed in order to accommodate left-handed students. A simulation is used in which 10%...
Khan Academy
Khan Academy: Comparing Data Displays
Practice interpreting and comparing dot plots, histograms, and box plots. Students receive immediate feedback and have the opportunity to try questions repeatedly, watch a video or receive hints.
ClassFlow
Class Flow: Data Analysis Using Graphing
[Free Registration/Login Required] This flipchart allows students to analyze data using appropriate graphs, including pictographs, histograms, bar graphs, line graphs, circle graphs, and line plots introduced earlier, and using...
CK-12 Foundation
Ck 12: Types of Data Representation: Graphic Displays of Data
[Free Registration/Login may be required to access all resource tools.] Here you will explore displays of data using bar charts, histograms, pie charts and boxplots, and learn about the differences and similarities between them and how...
Texas Instruments
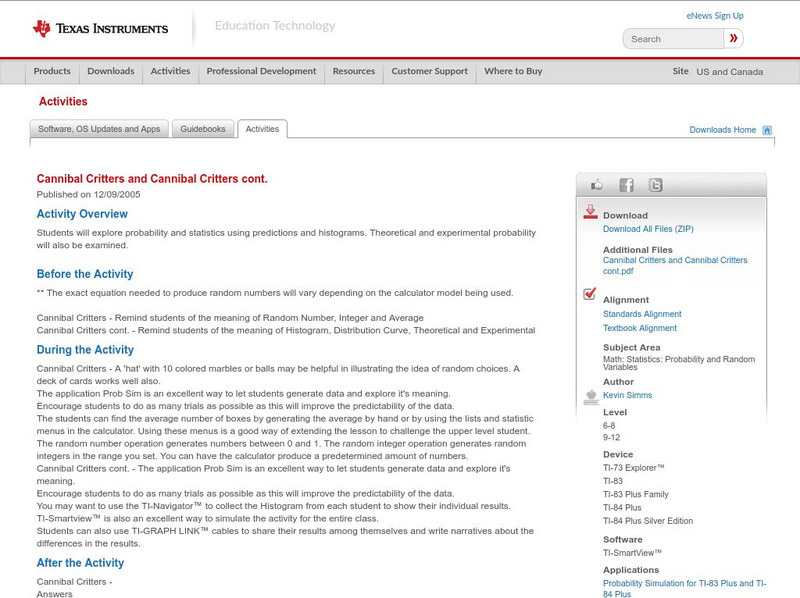
Texas Instruments: Cannibal Critters and Cannibal Critters Cont.
Students will explore probability and statistics using predictions and histograms. Theoretical and experimental probability will also be examined.
Texas Instruments
Texas Instruments: Selection Direction
In this activity you will produce histograms using the Data Graphs Wizard and learn about the concept of biological variance.
Texas Instruments
Texas Instruments: Now You See It, Now You Don't
In this activity, students study the relationship between age and near point accommodation (NPA). They predict a person's age using NPA distance values. They use exponential regression, create box-and-whisker plots and histograms.
Texas Instruments
Texas Instruments: Comparing Distributions of Univariate Data
Students compare univariate data distributions using statistical concepts like box plots, stem plots, and histograms.
Texas Instruments
Texas Instruments: Measure Up
In this activity, students compare their height with the average height of students in the class. They create histograms to analyze the data, and construct box plots to summarize the height statistics.
CK-12 Foundation
Ck 12: Statistics: Stem and Leaf Plots Grades 8 9
[Free Registration/Login may be required to access all resource tools.] Learn how to create stem-and-leaf plots and histograms in order to analyze data.
National Council of Teachers of Mathematics
Nctm: Illuminations: Advanced Data Grapher
The Advanced Data Grapher can be used to analyze data with box plots, bubble graphs, scatterplots, histograms, and stem-and-leaf plots.
National Council of Teachers of Mathematics
Nctm: Illuminations: State Names
Students use multiple representations to display how many times the letters of the alphabet is used in a state name. Concepts explored: stem and leaf, box and whisker plots, histograms.
Other
Nearpod: Introduction to Data Representation
In this lesson on representation data, students explore how to make dot plots, histograms, and box plots and learn about outliers in a data set.
Alabama Learning Exchange
Alex: Misleading Graphs Are Da'pits!
In this interactive lesson, students will discover how creating an incorrect graph will display misleading information. Through viewing and discussing a variety of graphs, the students will identify 5 components that graphs must contain...
ClassFlow
Class Flow: Graphs
[Free Registration/Login Required] This flipchart presents bar and double bar graphs, line and double line graphs, pictographs, histograms, and circle graphs with review activities and web links for practice.
University of Colorado
University of Colorado: Ph Et Interactive Simulations: Plinko Probability
Play Plinko and develop your knowledge of statistics. Drops balls through a triangular grid of pegs and see the balls random walk through the lattice. Watch the histogram of final positions build up and approach the binomial distribution.
Science Buddies
Science Buddies: Dry Spells, Wet Spells: How Common Are They?
Here's a project that looks at what the weather was like for over a hundred years. The goal of the project is to compare long-term precipitation patterns in different regions of the country. You will work with historical climate data,...
University of Colorado
University of Colorado: Ph Et Interactive Simulations: Plinko Probability
Drop balls through a triangular grid of pegs and see them accumulate in containers. Switch to a histogram view and compare the distribution of balls to an ideal binomial distribution. Adjust the binomial probability and develop your...
Other popular searches
- Bar Graphs and Histograms
- Bar Graphs Histograms
- Interpreting Histograms
- Creating Histograms
- Making Histograms
- Frequency Histograms
- Frequency and Histograms
- Math Lessons Histograms
- Histograms and Bar Charts
- Math Statistics Histograms
- Histograms Median
- Hypothesis and Histograms


