Other
Ohio Department of Education: Sixth Grade Achievement Test (Practice Test) [Pdf]
Half-length practice test for the third grade OAT (Ohio Achievement Test). The test includes 17 multiple-choice and 4 open-response question dealing with topics such as geometry (triangle identification, surface area), number sense...
Texas Education Agency
Texas Gateway: Selecting and Using Representations for Collected Data
[Accessible by TX Educators. Free Registration/Login Required] Given a variety of data (including line plots, line graphs, stem and leaf plots, circle graphs, bar graphs, box and whisker plots, histograms, and Venn diagrams), the student...
ACT360 Media
Act Den: In Living Color Lesson Plan
Add color to black and white photograph using this Paint Shop Pro lesson plan. Explore the colorize functions to make your pictures and graphics unique.
PBS
Pbs Learning Media: Harry's Allergy
Harry keeps track of the number of times he sneezes in certain locations to try to diagnose the cause of his allergy in this video segment from Cyberchase.
Shodor Education Foundation
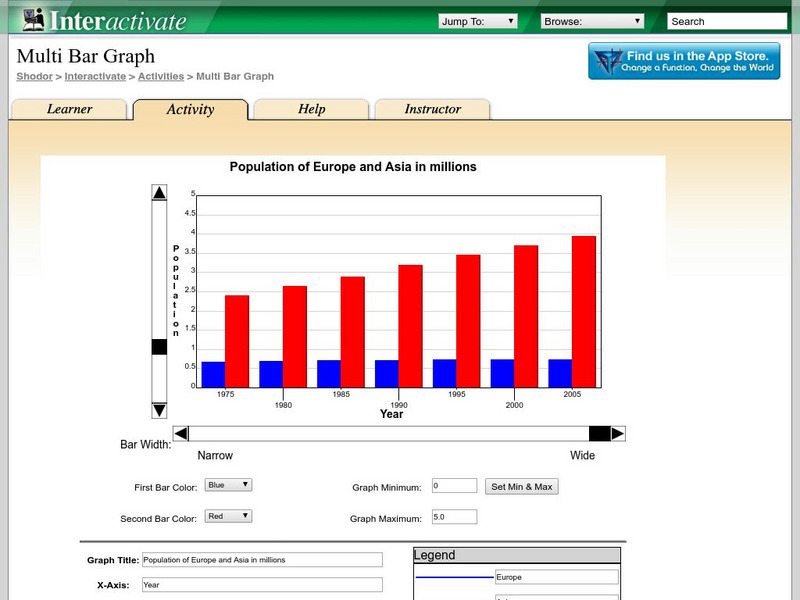
Shodor Interactivate: Multi Bar Graph
The interactive learning activity allows students to manipulate a double bar graph. Teacher resources are included.
PBS
Pbs Learning Media: Restocking Shoes
In this video from Cyberchase, Bianca uses data on past shoe sales to help her decide what quantities of each size she should order in the next shipment.
Other
Online Statistics Education: Graphing Distributions [Pdf]
This is the second chapter of a statistics e-text developed collaboratively by Rice University, University of Houston Clear Lake, and Tufts University. It looks at many different types of data displays and the advantages and...
Oswego City School District
Regents Exam Prep Center: Displaying Data
Use this lesson, practice exercise, and teacher resource in planning instruction on displaying data. In the lessons, you'll find definitions and examples of ways to collect and organize data, quartiles, and box-and-whisker plots, as well...
BSCS Science Learning
Bscs: Budburst Lilac Festival
In this Inquiry, students predict the best date to host a lilac blossom festival so that lilacs are in full bloom in the city where students live. Students are introduced to Project Budburst, a citizen science project in which volunteers...
Science Education Resource Center at Carleton College
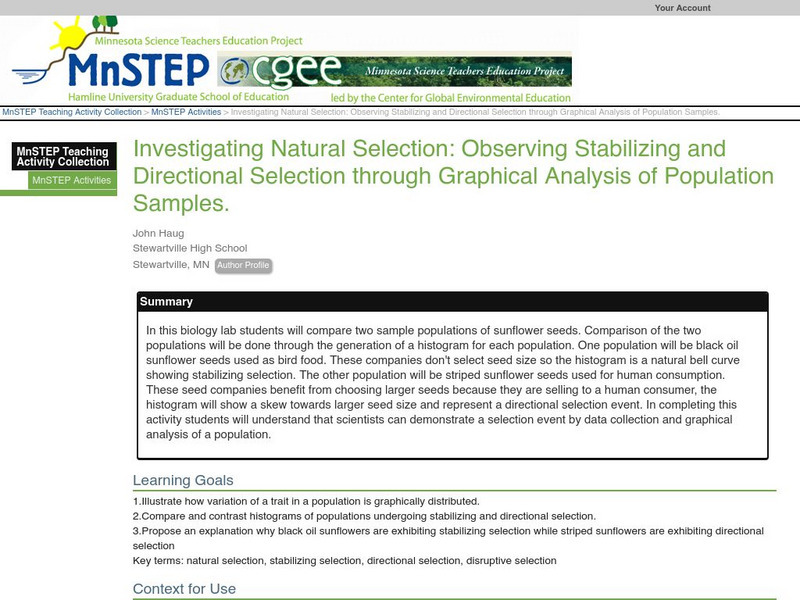
Serc: Investigating Observing Stabilizing and Directional Selection
In this biology lab students will compare two sample populations of sunflower seeds. Comparison of the two populations will be done through the generation of a histogram for each population. One population will be black oil sunflower...
Texas Instruments
Texas Instruments: Using the Ti 83/84 to Explore the Binomial Theorem
This lesson will introduce students to the binomial theorem through a variety of activities. Pascal's triangle and probabilities will be explored through problem solving. The binomial theorem, combinations formula, and the binomial...
Texas Instruments
Texas Instruments: Beverage Tests
In this activity, students determine the pH of liquid samples. They get familiar with the pH scale, create graphs comparing pH levels, and compare data displayed as a scatter plot, a boxplot, a histogram, and a bar graph.
Texas Instruments
Texas Instruments: Statistics for Math B
Students will determine the mean, median, mode and standard deviation of collected data. They will make a frequency histogram of the grouped data, both on graph paper, and on the TI 83+.
Texas Instruments
Texas Instruments: Call It Dominant or Recessive
In this activity, students simulate a Punnett square of a cross between two heterozygous individuals and produce a histogram. They compare actual and expected results of genetic crosses.
Other
Oswego City School District: Trimmed Mean
This site presents a histogram showing data used to find the trimmed mean.
Khan Academy
Khan Academy: Comparing Distributions
Practice comparing distributions that are presented in dot plots, histograms, and box plots. Students receive immediate feedback and have the opportunity to try questions repeatedly, watch a video or receive hints.
National Council of Teachers of Mathematics
The Math Forum: Data Collecting Project Stats Class
This lesson plan provides the teacher with all the necessary handouts and directions to give a statistics class when they are ready to complete a thorough survey project. Broken into five parts, it takes the students through the...
Texas Education Agency
Texas Gateway: Tea Statistics: Descriptive Statistics: Introduction
In these exercises to introduce descriptive statistics, students will construct a histogram and a box plot, calculate univariate statistics, and interpret the data in the graphs.
Other
Stat Soft: Statistics Glossary
Dozens of statistical terms are defined and illustrated in this glossary.
BSCS Science Learning
Bscs: Budburst Fall Colors
In this Inquiry, students engage in a debate between two characters about when a bed-and-breakfast (B&B) should have a fall leaf-peeping special to maximize the guest experience. Students are introduced to Budburst, a citizen science...
BSCS Science Learning
Bscs: Globe at Night Dark Skies
In this inquiry, students predict the best place to stargaze in Arizona based on the brightness of the night sky. Students are introduced to the concept of light pollution and Globe at Night, a global citizen science project in which...
BSCS Science Learning
Bscs: Frog Symphony
This inquiry focuses on analyzing spatial and temporal data for frog calls to determine the best time of day and location to hear a symphony of frogs. Click on the link for teaching guides and handouts.
BSCS Science Learning
Bscs: Globe at Night Dark Skies
For this inquiry, students predict the best place to stargaze in Arizona based on the brightness of the night sky. Students are introduced to the concept of light pollution and Globe at Night, a global citizen science project in which...
Wolfram Research
Wolfram Math World: Frequency Distribution
This site from MathWorld provides a general overview of frequency distribution, complete with a bar graph and explanatory text.
Other popular searches
- Bar Graphs and Histograms
- Bar Graphs Histograms
- Interpreting Histograms
- Creating Histograms
- Making Histograms
- Frequency Histograms
- Frequency and Histograms
- Math Lessons Histograms
- Histograms and Bar Charts
- Math Statistics Histograms
- Histograms Median
- Hypothesis and Histograms


![Ohio Department of Education: Sixth Grade Achievement Test (Practice Test) [Pdf] Study Guide Ohio Department of Education: Sixth Grade Achievement Test (Practice Test) [Pdf] Study Guide](https://d15y2dacu3jp90.cloudfront.net/images/attachment_defaults/resource/large/FPO-knovation.png)


