Curated OER
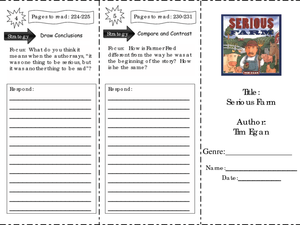
Serious Farm: comprehension skills
In this comprehension skills activity, students read the book Serious Farm and complete comprehension activities. Students complete activities such as plot, cause and effect, summarizing, drawing conclusions, and compare and contrast.
Curated OER
The Life of George Washington Carver: comprehension skills
In this comprehension skills worksheet, students read the book The Life of George Washington Carver and complete comprehension activities. Students complete 5 activities including note taking, making inferences, and drawing conclusions.
Curated OER
Arthur's Reading Race: comprehension skills
In this comprehension skills worksheet, students read the book Arthur's Reading Race and complete comprehension activities. Students complete 5 activities including story elements, making inferences, predicting, and drawing conclusions.
Curated OER
What's My Job?: comprehension skills
In this comprehension skills instructional activity, 2nd graders read the book What's My Job? and complete comprehension activities. Students complete 5 activities including setting, character traits, summarizing, main idea/details, and...
Curated OER
Representing Text Story Web: Pretest
In this story web instructional activity, students answer multiple choice questions about how to make and use a story web. Students complete 10 questions total.
EngageNY
Logarithms—How Many Digits Do You Need?
Forget your ID number? Your pupils learn to use logarithms to determine the number of digits or characters necessary to create individual ID numbers for all members of a group.
Inside Mathematics
Marble Game
Pupils determine the theoretical probability of winning a game of marbles. Individuals compare the theoretical probability to experimental probability for the same game. They continue on to compare two different probability games.
Inside Mathematics
Swimming Pool
Swimming is more fun with quantities. The short assessment task encompasses finding the volume of a trapezoidal prism using an understanding of quantities. Individuals make a connection to the rate of which the pool is filled with a...
California Education Partners
Animals of Rhomaar
Investigate the growth rates of alien animals. Pupils study fictional animals from another planet to determine how much they grow per year. The investigators plot the growth of their animals over a period of time and then compare them to...
California Education Partners
Speedy Texting
Model the effects of practice on texting speed. Pupils develop a linear equation that models the change in texting speed based on the amount of practice. The sixth performance task in an eight-part series requires learners to solve and...
Inside Mathematics
Graphs (2004)
Show your pupils that perimeter is linear and area is quadratic in nature with a short assessment task that requests learners to connect the graph and equation to a description about perimeter or area. Scholars then provide a...
Curated OER
Application and Modeling of Standard Deviation
The first activity in this resource has learners computing the mean and standard deviation of two different data sets and drawing conclusions based on their results. The second activity has them using a dice-rolling simulation to...
Shmoop
ELA.CCSS.ELA-Literacy.W.11-12.7
Your pupils are beginning their research project and are having a hard time narrowing their topics down. If you’re not sure how to help them, then start here. Provided is a student dialogue that works though the issues of narrowing a...
Curated OER
Germination Inhibitors
In germination experiment worksheet, students conduct the following lab activity. Students determine the effects of another tomato on germinating seeds. Students answer the following questions to analyze their experiment.
Inside Mathematics
Archery
Put the better archer in a box. The performance task has pupils compare the performance of two archers using box-and-whisker plots. The resource includes sample responses that are useful in comparing individuals' work to others.
Noyce Foundation
Ducklings
The class gets their mean and median all in a row with an assessment task that uses a population of ducklings to work with data displays and measures of central tendency. Pupils create a frequency chart and calculate the mean and median....
Classroom Law Project
What are some of today’s voting issues? Voting in Oregon, youth vote, and technology
The youth vote. Rock the Vote. Vote-By-Mail. Electronic voting. Class members investigate issues facing today's voters, and the ways they have adapted over the years to optimize voter turnout.
Earth Day Network
Filtering Water
See the water filtration system up close with a fun science experiment. Young scientists work for several class periods to design a water filter using household objects, and then decide which filter material would be most effective in...
Virginia Department of Education
May I Have Fries with That?
Not all pie graphs are about pies. The class conducts a survey on favorite fast food categories in a lesson on data representation. Pupils use the results to create a circle graph.
Inside Mathematics
Quadratic (2006)
Most problems can be solved using more than one method. A worksheet includes just nine questions but many more ways to solve each. Scholars must graph, solve, and justify quadratic problems.
Berkshire Museum
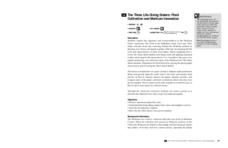
The Three Life-Giving Sisters: Plant Cultivation and Mohican Innovation
Children gain first-hand experience with Native American agriculture while investigating the life cycle of plants with this engaging experiment. Focusing on what the natives called the Three Sisters - corn, beans, and squash - young...
Curated OER
Project Conclusion
For this cells worksheet students answer questions regarding the characteristics of living organisms observed during a pond water survey. Students draw diagrams of a food chain.
Curated OER
How Does Vegetation Decrease Erosion?
For this erosion worksheet, students will compare what happens to soil when water flows over soil with no vegetation and soil with vegetation. Then, students will complete four short answer questions.
Curated OER
How Do Astronomers Measure Distances to Stars?
In this astronomy instructional activity, students participate in an activity using the parallax effect to measure star distances. They record their information in a data table then complete 5 fill in the blank conclusion questions.


