Alabama Learning Exchange
Time to Tell Time
Students demonstrate how to tell time using an analog clock. In this time measurement lesson, students read the book Clocks and More Clocks and use analog clocks to demonstrate the time that the teacher called out.
Teach Engineering
What is GIS?
Is GIS the real manifestation of Harry Potter's Marauders Map? Introduce your class to the history of geographic information systems (GIS), the technology that allows for easy use of spatial information, with a resource that teaches...
EngageNY
Using Matrix Operations for Encryption
Data encryption is an important security measure for sensitive data stored on computers. Pupils learn how to utilize matrices for creating code. They also get a great review of matrix multiplication, inverse matrices, and the identity...
Curated OER
How Do You Analyze a Corporation?
Students find out how to use annual reports to analyze a corporation whose stock they may buy for the Global Stock Game. They read the investor information section, which provides detailed information about the company's products and...
Curated OER
Budget Bonanza
Students demonstrate how to use a budget plan. In this consumer math instructional activity, students calculate the total cost of data and determine if they are within budget. Students use calculators to determine the total cost. There...
Shodor Education Foundation
Marbles
Grab some marbles from a bag. The applet simulates drawing marbles from a bag. Pupils determine the number of four colors of marbles in a bag and how many marbles to draw. Using information on whether order matters in the draw and if...
Shodor Education Foundation
Function Flyer
Fly through graphing functions with the Function Flyer. Young mathematicians use an interactive to graph different types of functions. A set of exploration questions has users investigate patterns in functions.
August House
Go to Sleep, Gecko
Use this multidisciplinary lesson to delve into these subjects: English language arts, math, science, drama, and character education. After reading, discussing, and making interpretations about Go To Sleep, Gecko!: A Balinese Folktale by...
Federal Reserve Bank
Sky Boys: How They Built the Empire State Building
How tall is the Empire State Building? Lead your class through a collaborative estimation activity to determine the number of quarters it would take to reach the top and teach the following concepts: human capital, human resources,...
Visa
Using Credit Wisely
Receiving credit can be both a benefit and a curse. Prepare your learners to make wise credit choices by studying how credit influences credit scores, identifying the different components of credit cards, and exploring major consumer...
Visa
Money Matters: Why It Pays to Be Financially Responsible
What does it mean to be financially responsible? Pupils begin to develop the building blocks of strong financial decision making by reviewing how their past purchases are examples of cost comparing, cost-benefit analysis, and budgeting.
Curated OER
A Tour of Jaffa
Use the age-old Traveling Salesman Problem to introduce Hamilton circuits to your young travelers. Individuals then plan an efficient route to visit all the places they want to go.
Shodor Education Foundation
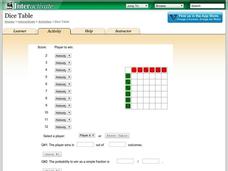
Dice Table
Convert a table to probabilities. Pupils set up the winning rules for the sums of two dice. Using the rules, the applet fills out a table showing the winners for each combination. Learners determine the probabilities of winning for each...
US Department of Commerce
Where to Next?
Salary, education, census statistics ... how do people choose their careers? Scholars complete worksheets and rely on census data to determine their career aspirations. Then, pupils conduct Internet research about places they would...
Teach Engineering
Seeing All Sides: Orthographic Drawing
How can your draw three-dimensional figures on paper? The lesson shows pupils how to draw orthographic projections of three-dimensional figures composed of cubes. After viewing a PowerPoint presentation, they practice this skill with...
Shodor Education Foundation
Regression
How good is the fit? Using an interactive, classmates create a scatter plot of bivariate data and fit their own lines of best fit. The applet allows pupils to display the regression line along with the correlation coefficient. As a final...
Shodor Education Foundation
Scatter Plot
What is the relationship between two variables? Groups work together to gather data on arm spans and height. Using the interactive, learners plot the bivariate data, labeling the axes and the graph. The resource allows scholars to create...
Shodor Education Foundation
Life
How does life evolve? The interactive provides a simulation based on the Game of Life invented by mathematician John Conway. Users can run the applet with the preset rules and settings or adjust them to view whether overpopulation or...
Shodor Education Foundation
Derivate
Derive tangent lines through derivatives. Scholars use an app to graph functions and investigate derivatives and tangent lines. The interactive automatically graphs a tangent line at a specified point and can also produce tables of values.
Shodor Education Foundation
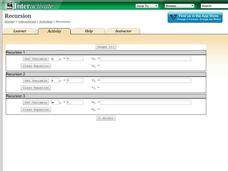
Recursion
Perform the operation ... and then do it again. Scholars investigate recursive formulas by creating and graphing them. Using the interactive, pupils set the variable, determine the initial value, and type in a recursive formula.The...
Curated OER
Internet Measurement
Students become familiar with how to get information from the Internet. In this math and technology lesson plan, students measure objects on a measurement sheet found on a web site. They practice using a standard unit of measurement...
Curated OER
How to Graph in Excel
Fourth graders construct data graphs on the Microsoft Excel program. In this statistics lesson, 4th graders formulate questions and collect data. Students represent their results by using Excel.
Curated OER
Flicking Football Fun
Young mathematicians fold and flick their way to a deeper understanding of statistics with a fun, hands-on math unit. Over the course of four lessons, students use paper footballs to generate data as they learn how to create line...
EngageNY
Informally Fitting a Line
Discover how trend lines can be useful in understanding relationships between variables with a lesson that covers how to informally fit a trend line to model a relationship given in a scatter plot. Scholars use the trend line to make...


