Curated OER
MS Word Skills Assessment
Students are assessed on their use of the Microsoft Word program. In this word processing assessment, students are asked to complete a list of tasks in the Microsoft Word program to determine their knowledge of the program.
Texas Instruments
A Tale of Two Lines
Students graph systems of equation. In this calculus instructional activity, students graph their lines on a TI calculator. They identify the point of intersection and the type of solution.
Curated OER
Slope Fields
High schoolers create and analyze slope fields. In this calculus activity, students create a visual of differential equations. They use the Ti Navigator to create slope fields.
Curated OER
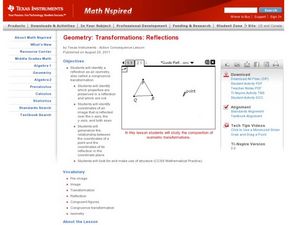
Transformations: Reflections
Students perform transformations on their graphs. In this algebra instructional activity, students identify the pre-image and image. They find and identify congruent shapes and isometry.
Curated OER
Exploring a Newspaper
Students explore the parts of a newspaper and identify the main idea of a newspaper article. They locate three sections of the newspaper, name the main parts of a newspaper article, and recognize the main idea of a newspaper article.
Curated OER
Code Talkers
Students investigate the Navajo code talkers contributions to World War II. They read and discuss a fact sheet, and create and decode secret messages using a Navajo code talkers' dictionary.
Curated OER
Biodiversity and Ecosystems
Middle schoolers differentiate between biotic and abiotic factors in this science lesson plan. Learners collect data for the experiment and analyze the data after graphing it using the CBL 2. This experiment is split into two different...
Curated OER
The Disappearing Kelp Forest
Learners observe the effect "El Nino" left on kelp plants and sea urchins. They analyze the data collected by researchers, by graphing it on a TI calculator. Before graphing and analyzing the data, you may want to revisit the events of...
Curated OER
The Effect of Acid Rain on Limestone
Pupils investigate the pH of rain water in this earth science lesson. They collect rain water from their area and explore the pH when lime stone is added, then they will use the data collected to conjecture as to the effect of acid rain...
Curated OER
Hess's Law
Pupils solve chemical equations. In this chemistry lesson, they balance chemical equations after completing a lab. They can use a TI for this assignment.
Curated OER
Energy Content of Foods
Learners collect data, organize and analyze the data and compare it to real life scenarios. This assignment requires two class periods.
Curated OER
Keep it Bottled Up: Linear Rates of Pressure Increase
Pupils explore linear functions in this lesson when they collect and analyze data as a chemical reaction proceeds. Learners record pressure versus time data and model the data as a linear function. They also examine the concept of slope...
Curated OER
Lemon "Juice"
Middle schoolers explore the concept of electricity in this lesson as they measure the electricity that a lemon gives off. Learners use volt meters to measure the amount of electricity coming from the lemon. Your class will also measure...
Curated OER
Let the River Run
Pupils examine deposits found in a river in this science lesson plan. They collect data of sediment deposit found in the Mississippi river, then graph and analyze their data using the TI.
Curated OER
Shedding Light on the Weather with Relative Humidity
Learners study weather using a graphing calculator in this lesson plan. They collect data for temperature and relative humidity for every hour over a day from the newspaper, then place the data in their handheld calculator and examine it...
Texas Instruments
When pH Changes What Happens?
Learners explore the pH of water in this fourth through ninth grade science lesson. They test water samples to determine the pH, then record observations at the aquatic site and compare their observations with the pH readings.
Curated OER
Does Clear Water mean Healthy Water?
Learners test their local aquatic site to determine its water clarity. They collect a water sample and measure its turbidity using a sensor, then they repeat the experiment to obtain a second turbidity reading to find the average value.
Texas Instruments
Light and Day
Pupils explore the concept of collecting data as they collect data on their graphing calculator about time, temperature, and light. Learners plot the data and create histograms and box and whisker plots to analyze the data.
Texas Instruments
Measuring Air Pressure Lab
Your class can investigate the weather through an experiment. In this chemistry lesson plan, learners collect data on air pressure and relate it to the weather. They collect data with the TI containing a barometer probe.
Curated OER
When the Snow is as High as an Elephant
High schoolers study the concept of mean values using a data plot. Learners enter the given data in the activity to create their data table. They use the data table to calculate the mean of the snowfall percentage provided in the...
Curated OER
Health of Aquatic Life a Real Problem
Learners explore the health of aquatic life in this science lesson They measure and track the oxygen level in the water to determine the health of the aquatic life. They collect this data using the TI explorer to graph and analyze their...
Curated OER
Land Erosion - Does Vegetation Matter?
Young learners explore erosion, deposition, weather and climate in this science instructional activity. They discuss the cause of erosion, collect data and analyze it suing the TI Explorer. They can also use the TI CBL or Vernier LabPro...
Curated OER
Corn-Crop is a Bin-Buster
Learners calculate percent change and create lists of data. They enter the corresponding bushels of corn measured in billions to their list and display, then convert the acres into scientific notation and use the value on the home screen...
Texas Instruments
Land Erosion - Running Off With Soil
Learners evaluate the relationship between rainfall and runoff of a small island for one year. For this rainfall vs. runoff lesson, students analyze the relationship between the rainfall and the runoff on Barro Colorado Island over a...


