Curated OER
Ice Cream
Young scholars explore the concepts of mean, median, mode, and range as they elicit data about people's favorite flavor of ice cream. A practical application of the data obtained offers an extension to the lesson plan.
Curated OER
How Many Ice Creams?
Students discuss their favorite ice cream flavors and read the math problem. They brainstorm the problem and brainstorm for ways to solve the problem. Students work in pairs and share solutions.
Scholastic
Study Jams! Tree Diagrams
With so many toppings to chose from, make the ice cream truck combinations a fun math problem that teaches your learners about outcomes. The video introduces a tree diagram that allows your mathematicians to see how to create...
Curated OER
Ice Creams
Students list all the outcomes for single events, and for two successive events in a systematic way. When dealing with a combination of two experiments, they identify all the outcomes, using diagrammatic, tabular or other forms of...
Curated OER
How Many?
Students investigate concepts related to data collection and interpretation. They generate all possible outcomes in a beginning study in the realm of statistics. The use of real life situations helps to engage students.
Curated OER
Food Probability
In this math worksheet, students plot the possibilities of outcomes for making sandwiches and ice cream in the graphic organizers.
Curated OER
Consider the Possibilities
In this math worksheet, students analyze 4 story problems which have questions about possible outcomes. Students answer the questions which involve money, calendar and fractions.
EngageNY
The Opposite of a Number's Opposite
It's said that opposites attract, but what about opposites of opposites? Individuals learn about the opposite of opposites using number lines. They complete a group activity in which members determine the opposite of opposites of...
EngageNY
Summarizing Bivariate Categorical Data in a Two-Way Table
Be sure to look both ways when making a two-way table. In the lesson, scholars learn to create two-way tables to display bivariate data. They calculate relative frequencies to answer questions of interest in the 14th part of the series.
Curated OER
Statistics and Probablility
Statistics and Probability are all about collecting, organizing, and interpreting data. Young learners use previously collected data and construct a picture graph of the data on poster board. This stellar lesson should lead to...
Curated OER
A Birthday Basket for Tia
Students practice reading and math skills using technology. In this main idea instructional activity, students retell the important events of A Birthday for Tia in sequence using Kid Pix. Students create a bar graph...
Curated OER
Marshmallow Figures
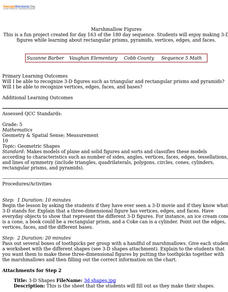
Students enjoy making 3-D figures while learning about rectangular prisms, pyramids, vertices, edges, and faces. After a lecture/demo, students use marshmallows, toothpicks and a worksheet imbedded in this lesson to create 3 dimensional...
Curated OER
"A Slice of the Cone"
Here is a set of lessons that explore conics in a number of different ways. Starting with modeling how a conic is produced by the way a plane cuts the cone, to solving complex word problems, algebra learners progress through a series of...
Curated OER
Multiplication Stories
Second graders solve various multiplication math word problems involving cars and people, fish and fish bowls, and tables and table legs. They write and solve multiplication story problems related to whole numbers, addition, subtraction,...
Curated OER
Charts and Graphs
Fifth graders interpret data into graphs and percentages. In this organizing data lesson, 5th graders discuss bar, circle and line graphs. Students complete bar graph and apply probability using the results.
Curated OER
Concept Attainment Model: Volume and Surface Area
Using a concept attainment approach, learners identify surface area and volume by sorting examples (photos) that depict each concept (positive) from those that don't (negative). Then as a class, they develop definitions of each...
Raytheon
Probability, Percent, and Proportion
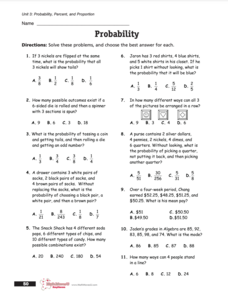
For this probability and predictions learning exercise, students read 1 page of facts, then solve 8 pages of problems related to probability, with answers keys included.
Curated OER
Pyramids and Prisms: Guler's Formula
Sixth graders detect and categorize the attributes of geometric shapes to solve problems. In this geometry lesson, 6th graders construct a variety of polyhedra. Students recognize the relationships between two dimensional and three...
Curated OER
Pyramids & Prisms: Guler's Formula
Sixth graders compare and contrast two-dimensional shapes to three-dimensional shapes. After watching a demonstration, they make their own shapes using nets printed on paper. To end the lesson, they use the shapes they made and...
Curated OER
How Much Cereal
Second graders investigate volume through the use of measuring cups. They complete a variety of measuring tasks using kitchen measuring cups. Students accurately measure the volume and compare the results.
Curated OER
Ordering Fitness Fun
Students participate in a practice activity in which they must remember the order of the numbers 1-10 and then 10-20. In teams, they participate in a relay race in which they must place number cards in the correct order on a number line.
Curated OER
Making Decisions with Probability
Learners explore probability. They discuss the likelihood of events happening and the terms certain, impossible, likely and unlikely. Students discuss various situations and the likelihood of that situation occurring.
Curated OER
Juan Bobo Sends the Pig to Mass
Students read the story Juan Bobo Sends the Pig to Mass and complete language arts activities connected to the story. In this language arts lesson plan, 1st graders complete activities including discussion, reading, writing,...


