National Wildlife Federation
The Tide is High, but I’m Holding On… Using ICESat Data to Investigate Sea Level Rise
Based on the rate of melting observed from 2003-2007 in Greenland, it would take less than 10 minutes to fill the Dallas Cowboys' Stadium. The 17th lesson in a series of 21 has scholars use the ICESat data to understand the ice mass...
Polar Trec
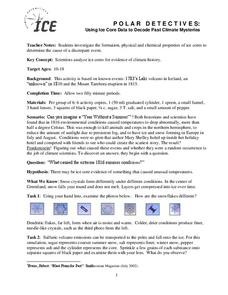
Polar Detectives: Using Ice Core Data to Decode Past Climate Mysteries
How does examining an ice core tell us about weather? Learners set up and explore fake ice cores made of sugar, salt, and ash to represent historical snowfall and volcanic eruptions. From their setups, scholars determine what caused the...
Beyond Benign
The Big Melt: Arctic Ice Caps
Are the Arctic ice caps really melting out of existence? Junior climatologists examine the statistics of ice decline through four math-based lessons. Each activity incorporates data, climate information, and environmental impact into an...
Polar Trec
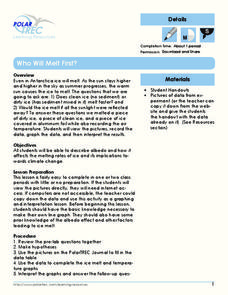
Who Will Melt First?
If the Greenland ice sheet melted, sea levels would rise by about 20 ft; if the Antarctic ice sheet melted, sea levels would rise by 200 ft. Scholars explore ice melting through the analysis of different ice samples, clean and dirty ice....
National Wildlife Federation
Wherefore Art Thou, Albedo?
In the sixth lesson plan in a series of 21, scholars use NASA data to graph and interpret albedo seasonally and over the course of multiple years. This allows learners to compare albedo trends to changes in sea ice with connections to...
Nevada Outdoor School
Let It Snow! Let It Melt!
Winter weather offers a great opportunity to teach young scientists about the states of matter. This activity-based lesson includes a range of learning experiences, from experimenting with the rate at which ice melts...
Curated OER
Changing Planet: Melting Glaciers
Resource links to a video, satellite images, data, and photographs of glaciers provide emerging earth scientists the opportunity to examine how the ice has been retreating over the years. A data table is included for pupils to record...
Howard Hughes Medical Institute
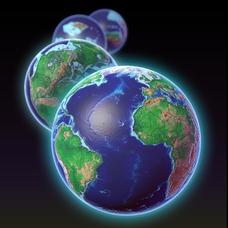
EarthViewer
Can you imagine Washington DC and London as close neighbors occupying the same continent? Learners will be fascinated as they step back in time and discover the evolution of the earth's continents and oceans from 4.5 billion...
Curated OER
March of the Polar Bears: Global Change, Sea Ice, and Wildlife Migration
Young scholars study global change and how these changes impact wildlife. In this polar bears lesson plan students analyze maps and data to understand climate change.
Curated OER
Ice Cream Lab
I scream, you scream, we all scream for ice cream! Even high schoolers enjoy making ice cream. This laboratory exercise has them record the temperature changes throughout the process of liquid becoming solid, graph the results, and...
Space Awareness
The Big Meltdown
Explore the world (our world) of melting ice caps. Why are these caps melting? What is the effect of melting ice caps? Dive into the ever-present issue of global warming with a resource that has learners looking at data and participating...
Curated OER
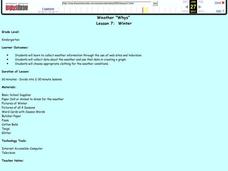
Weather "Whys"
Students explore the weather. In this weather data lesson, students collect weather data from Internet and media sources. Students graph the collected data discuss it as well as the seasons of the year.
Teach Engineering
Insulation Materials Investigation
Don't melt away! Pairs investigate different insulation materials to determine which one is better than the others. Using a low-temp heat plate, the teams insulate an ice cube from the heat source with a variety of substances. They...
Curated OER
Antarctica’s Melting and the Affect it has on the Ocean
Students calculate how much mass is lost and gained by Antarctica yearly. In this earth science instructional activity, students graph and analyze data from the given handout. They explain how this affects the world climate.
University of Chicago
Don't Be Too Flaky
Snow, ice, and water are all composed of H2O. Does that mean they all have the same volume? Discover the ways that the densities of these substances determine their volumes, and how they change based on their current states of...
NASA
Cloudy vs. Clear - Graphs
Explore the link between solar energy and cloud cover using real data from NASA from China! Future climatologists analyze and interpret graphs of solar energy on clear and cloudy days using a literacy cube. Investigators draw conclusions...
Curated OER
Ice Cream Lab
This very thorough lesson plan has students collect all ingredients necessary and work in pairs to make ice cream using plastic bags. They take temperature readings and record them on the chart as well as record findings on the...
Curated OER
Rain Formation
First graders investigate the different water formations by conducting an experiment. In this water properties lesson, 1st graders examine jars filled with ice, rain water, air and snow in their class. Students predict what...
Curated OER
Ice Cream Blizzards
Fourth graders explore whether the making of homemade ice cream is a physical change or a chemical change in a lab experiment. Students identify states of matter, describe the physical properties of states, and collect temperature data...
NOAA
Exploring Potential Human Impacts
Arctic sea ice reflects 80 percent of sunlight, striking it back into space; with sea ice melting, the world's oceans become warmer, which furthers global warming. These activities explore how humans are impacting ecosystems around the...
Curated OER
Glaciers: Then and Now
A large data table is given to your elementary earth scientists in which they record observations that they make while viewing pictures of Alaskan glaciers. They compare and contrast recent photos with older photos. Hold a discussion...
Curated OER
The Heat of Fusion of Ice
Learners measure the heat of fusion of ice. In this heat of fusion lesson plan, students use a calorimeter or Styrofoam cup and thermometer to measure the change in temperature of the water in their calorimeter. This allows learners to...
Curated OER
Ice Cream: a Taste of Science!!
Students define the term solution. They explain conservation of energy and energy transfer as it relate to how the milk solution became ice cream. Students are able to explain freezing point depression.
Curated OER
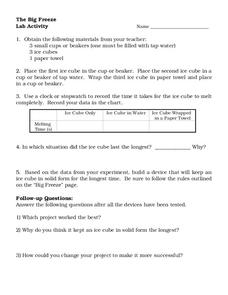
The Big Freeze
In this lab activity worksheet, students record the time it takes for an ice cube to melt in three different situations. After collecting data they design a container that will keep an ice cube in a solid state for as long as possible.


