Curated OER
Euro 2008
Students discover details about the world of British football. In this current events lesson, students browse selected websites to explore the work and history of the game, the Euro 2008, and the business aspects of the game in Britain.
Curated OER
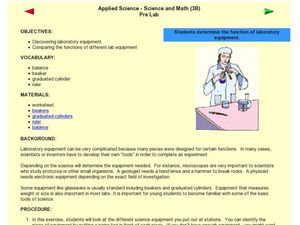
Applied Science -- Science and Math (3B) Pre Lab
Set up stations around your science lab to introduce youngsters to different equipment. They examine a beaker, graduated cylinder, ruler, balance, and thermometer. The said worksheet is not included, but you will find a few useful tips...
Curated OER
Mathematics: Best Salary
Sixth graders pretend to need jobs to earn money for a go-cart which costs $1,000. They predict which of two scenarios raise the money first. they construct charts and graphs to demonstrate their predictions.
Curated OER
The Mister Runtles' Bet
Students listen to a story dealing with exponential and linear growth. After reading the story, students complete a table comparing information. Using a calculator, students graph the rice and daily population of flies. They study the...
Curated OER
Exploring the Area Under a Curve
Using TI-89, mathematicians explore and investigate Riemann sums to estimate the area under the graphs of intervals by drawing and illustrating rectangles. They review and practice the concepts of summation notation and area formulas to...
Curated OER
Let's Gather Around the Circle
Scholars explore the relationship between circumference and diameter. Groups of learners measure the diameter and circumference of round objects and record their data on a given worksheet. They then input the data into their graphing...
Curated OER
Graphing Systems at the Races
Learners investigate systems of equations as they use the Ti-Navigator to explore scenarios about dog races and NASCAR races. Pupils determine the winner of the race and when opponents pass each other given a speed and distance.
Curated OER
Walk the Line
Learners create constant speed versus motion graphs. They will perform linear regressions on their data to describe the graphs mathematically.
Curated OER
Average Rate of Change, Difference Quotients, and Approximate Instantaneous Rate of Change
Pupils, with the assistance of their TI-84 Plus / TI-83 Plus calculators, distinguish meanings from right, left and symmetric difference quotients that include rate of change and graphical interpretations. They utilize symmetric...
Curated OER
Points on a Line
How do you find slope? You use points on a line of course. slope. Teach your class how to calculate and differentiate between horizontal and vertical lines. They are sure to be pros at graphing lines on a coordinate plane by the end of...
Curated OER
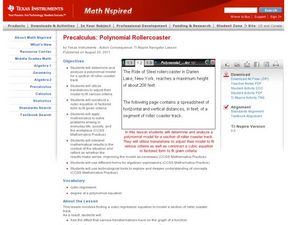
Polynomial Rollercoaster
Learners relate polynomials to a rollercoaster track as they translate a graph around on a coordinate plane. They differentiate between different forms of algebraic expressions.
Curated OER
Collecting Ball Bounce Data
Learners investigate quadratic equations as they use a CBR to collect and analyze data regarding a bouncing ball. Pupils explore different methods for determining the equation of the parabolic path including quadratic regression and...
Curated OER
Archeologist Frieze Patterns
Learners construct frieze patterns using translations and rotations. They will discuss how frieze patterns are similar to jigsaw puzzles and use Cabri Jr. to build a triangle frieze pattern using rotations, translations, and reflections.
Curated OER
Energy Content of Foods
Learners collect data, organize and analyze the data and compare it to real life scenarios. This assignment requires two class periods.
Curated OER
Does Clear Water mean Healthy Water?
Learners test their local aquatic site to determine its water clarity. They collect a water sample and measure its turbidity using a sensor, then they repeat the experiment to obtain a second turbidity reading to find the average value.
Texas Instruments
Light and Day
Pupils explore the concept of collecting data as they collect data on their graphing calculator about time, temperature, and light. Learners plot the data and create histograms and box and whisker plots to analyze the data.
Curated OER
Angling for Distance
Explore the concept of projectile distance through determining the angle that will provide the maximum distance of a launched projectile. Students launch baseballs on a football field and video tape the path of the ball.
Curated OER
FCAT Real World Solving Linear Equations/Systems
Pupils relate real life situation to the equations, graphs and inequalities. They model real life scenarios using matrices and draw conclusions from their data. This lesson plan is aligned with FCAT.
Curated OER
Curve Fitting
Pupils investigate linear, quadratic, and exponential regressions. They plot sets of data points, determine the regression equation that best fits the data and lastly investigate the coefficient of determination.
Texas Instruments
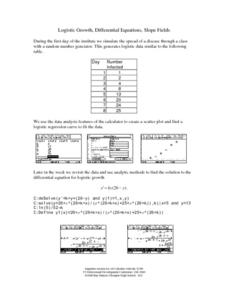
Logistic Growth, Differential Equations, Slope Fields
Investigate differential equations with your class. They use the TI-89 to explore differential equations analytically, graphically, and numerically as the examine the relationships between each of the three approaches.
Curated OER
Domian and Range of Graphs
High schoolers determine the domain and range of various graphs using a graphing calculator. Given a set of graphs to analyze, learners calculate the range and domain of the graphs by plotting the graphs on their calculators. Downloads...
Curated OER
Implicit Differentiation
Pupils explore the concept of derivatives. They use implicit differentiation to determine points on a graph where a tangent line is horizontal, vertical, or oblique. Finally, learners find the derivative of a polynomial by...
Curated OER
Quartic Inflection
Learners use their TI-89 calculator to find properties of the quartic polynomials. The instructional activity includes detailed instructions along with screen shots of the graphing calculator display.
Curated OER
Fraction Decimal Challenge
Pupils explore the concept of fractions and decimals as they try to find as many fractions as possible that are equivalent to .25. Learners use their calculator to take screen shots and send them to the teacher via Ti-Navigator. They...


