Curated OER
I Have Who Has Cards - Integration Formulas
In this calculus instructional activity, students rewrite a word problem using algebraic symbols and calculate the derivative of a function to find the correct solution. There are 20 matching questions with an answer key.
Curated OER
Shedding Light on the Weather with Relative Humidity
Learners study weather using a graphing calculator in this lesson. They collect data for temperature and relative humidity for every hour over a day from the newspaper, then place the data in their handheld calculator and examine it for...
Curated OER
Corn-Crop is a Bin-Buster
Learners calculate percent change and create lists of data. They enter the corresponding bushels of corn measured in billions to their list and display, then convert the acres into scientific notation and use the value on the home screen...
Curated OER
Extra Review
In this quadratic formula worksheet, students solve and complete 22 different types of problems. First, they solve each equation by completing the square and applying the quadratic formula. Then, students graph each function provided and...
Curated OER
Which Method Will You Choose? Finding Solutions to Systems of Equations.
Ninth graders investigate systems of linear equations. In this Algebra I lesson plan, 9th graders determine which method is the best for solving a systems: graphing, substitution, or elimination. Students choose a method and create a...
Curated OER
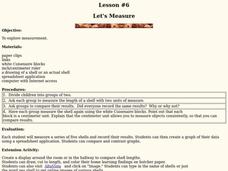
Let's Measure
Young scholars measure shells using 3 different methods. In this measurement lesson, students work in two groups to measure the length of a shell using two different units of measure. The groups compare their results, measure the shell...
Curated OER
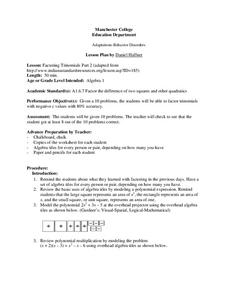
Factoring Trinomials
Students factor trinomials and other quadratic functions. In this algebra lesson, students solve trinomials containing negative and positive coefficients. They factor quadratics of difference squares as well as regular polynomials.
Curated OER
Multiplying Polynomials using the Distributive property.
Students factor polynomial functions. In this algebra lesson, students solve problems through factoring and distribution of the negative sign correctly.
Curated OER
Introduction of Single and Multiple Linear Inequalities
Students solve linear inequalities. In this algebra lesson, students rewrite inequalities using one and two step equations. They graph their findings and identify the slope and solution of the line.
Curated OER
The Window Problem
Students identify patterns and compute formulas to solve the problems. In this algebra activity, students come up with a rule given a pattern, and analyze the relationship between data and graphs.
Curated OER
Lub Dub
Students name the vessels and parts of the heart. They trace the path of blood through the heart. Students examine the function of the circulatory system. They recognize the differences between a hear when the body is at rest opposed to...
Curated OER
Match Me!
Young learners explore motion graphs in this lesson. They investigate distance-time plots as they move in a specific way in front of the CBR in an attempt to make a motion plot that matches a given plot. Pupils explore the connections...
Curated OER
Burger King Investigation
Students study data on the nutritional value of Burger King meals in order to discover its nutritional value and also to compare the meals, using mathematical computation, to the recommended daily diet. For this data handling lesson,...
Curated OER
Graphs
For this algebra worksheet, students solve linear equations through graphing and quadratic equations through factoring. There are 4 questions dealing with systems of equations.
Curated OER
Money
Students practice counting money. In this counting and comparing money lesson, students review the value of coins and use play money to count out five dollars. Students complete a worksheet to determine what items they could buy...
Curated OER
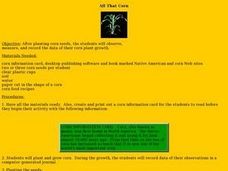
All That Corn
Students observe and record data. In this plant growth lesson, students plant and grow corn. Students observe the growth of their corn and record their data. Students read corn recipes and select their favorite four recipes to write...
National Council of Teachers of Mathematics
Seeing Music, Hearing Waves
In this music activity, 11th graders incorporate fractions into their music scales and counting scales. They listen to the music being played and relate it to sine waves reviewing the trig function. There are 11 questions involving sine...
Curated OER
Inflation and Unemployment
Young scholars explore the role of government in the economy market. In this economics lesson, students analyze the decision making and how it takes into consideration additional cost, benefits and public awareness of what they are...
Curated OER
Data Collection
High schoolers investigate qualitative and quantitative data. For this statistics lesson, students gather data on heights and weights of people and graph the distribution. High schoolers discuss the differences between qualitative and...
Texas Instruments
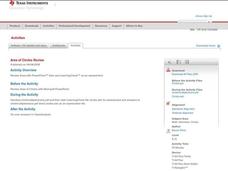
Area of Circles
Students explore circles. In this algebra/geometry lesson, students discover the formula for the area of a circle, as they investigate the ratio of the area of a circle to the radius^2.
Curated OER
Frequency Tables and Stem-and-Leaf Plots
Students are introduced to the function of frequency tables and stem and leaf plots. In groups, they determine the frequency of their teacher coughing, ringing a bell or raising their hand. To end the lesson, they determine frequency...
Curated OER
Graph Polynomial Functions
Pupils explore a method of checking the sum or difference of polynomials by graphing the problem and the simplified answer and comparing the graphs.
Curated OER
Triangle in the Matrix
Young mathematicians represent a triangle with a matrix and use the determinant to find the area of three given triangles. Learners also verify the formula for area of a triangle.
Curated OER
Math and the NFL - Statistical Representations
Seventh graders use the Internet to get current sports information for data analysis. They use their data to find the mean, median, mode and range. Students then place their data on a spreadsheet.


