Curated OER
Graph the Presidents At Inauguration- How Old Were They?
Students construct a graph of the presidents' ages at inauguration. In this U.S. history lesson, students use online resources to gather data about the presidents and accurately present their results on a graph.
Curated OER
Histograms
In this histograms worksheet, learners solve 5 word problems based on a histogram of presidential ages at their inauguration. Next, students create a frequency table and a histogram based on a list of data which shows the average...
Curated OER
Understanding Presidential History
Students research to find the qualifications necessary to be President of the U.S. In this presidential qualification lesson, students research their family roots to see if they could qualify to be President. Students create a graph to...
Curated OER
Lasting Legacies of Ancient Greece
Ancient Greece lesson plans can open up a world of information for students.
Curated OER
Digital Dreams
Young scholars write a speech. In this dreams lesson, students define the word dreams and list their own dreams. Young scholars read and discuss Langston Hughes work, read and discuss excerpts from speeches by JFK and Martin Luther...
Curated OER
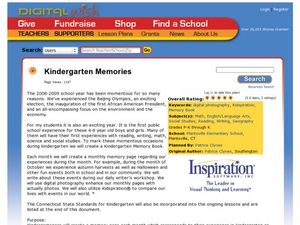
Kindergarten Memories
Young scholars create a monthly memory and compile it into a Kindergarten Memory Book. In this memory book lesson plan, students create a monthly memory page. Young scholars create a graphic organizer in Kidspiration which is developed...


