5280 Math
Go with the Flow
Round and round they go ... where they stop, only scholars will know. By writing systems of equations, classes determine the number of cars a roundabout can handle given specific constraints. Systems use up to six variables and become...
Visa
Living On Your Own
Learners gain a realistic understanding of what is required for independent living. They begin by setting up a budget based on needs and lifestyle, and then use worksheets and a presentation to practice such skills as reading a rental...
Illustrative Mathematics
How Many Buttons?
Bring the class into the probability by having everyone count buttons on their shirts. Organize the data into the chart provided and chose different possibilities such as "female with one button" or "all students with more than four...
EngageNY
The Scaling Principle for Area
As they investigate scaling figures and calculate the resulting areas, groups determine the area of similar figures. They continue to investigate the results when the vertical and horizontal scales are not equal.
EngageNY
What Is a Trigonometric Identity?
Protect yourself from identity theft! Establishing a strong understanding of the Pythagorean identity allows learners to prove that sine^2x + cos^2x = 1. They then use the identity to find sine or cosine ratios given the other.
Physics Classroom
Using Graphs
Many university professors complain incoming scholars struggle with interpreting graphs. A skill builder offers three different types of exercises including calculating slope, interpreting graphs, and extrapolating outside the plotted...
Curated OER
Advanced Introduction to TI-8x Calculators: Programming in TI-Basic
High schoolers program a TI-Basic calculator. In this calculator programming lesson, students explore how to create and graph a linear equation. High schoolers study how to input variables into the function and read the graph output.
Curated OER
Adding Creativity to Science Inquiry
Middle schoolers investigate friction by manipulating some of the variables affecting it. In this inquiry lesson, students design their own experiment. They create a video about it and share it to class.
Curated OER
Guess the Age
Students describe graphically, algebraically and verbally real-world phenomena as functions; identify the independent and the dependent variable. They translate among graphic, algebraic, and verbal representations of relations and graph...
Curated OER
Factors That Affect Climate
Fifth graders use captured portions of the Internet ("mininets") to perform research into climate. They create graphs of the data recorded using latitude as the independent variable and temperature as the dependent variable.
Curated OER
Measuring Temperature and the Production of CO2 in Yeast
Students use a model experiment to complete an experiment on yeast. In groups, they identify the independent and dependent variables and use the scientific method to complete the activity. They record their observations and discuss them...
Utah Education Network (UEN)
Linear Relationships: Tables, Equations, and Graphs
Pupils explore the concept of linear relationships. They discuss real-world examples of independent and dependent relationships. In addition, they use tables, graphs, and equations to represent linear relationships. They also use ordered...
Curated OER
Does The Lab Coat Fit?
Students describe the steps in the research process and identify the three requirements for a true experiment. They define independent and dependent variables. They discuss the Agriscience Student of the Year award and list the five...
Curated OER
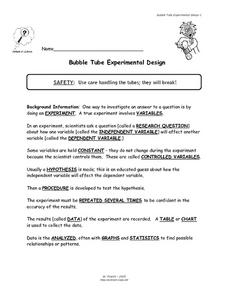
Bubble Tube Experimental Design
Middle schoolers study what an experiment is comprised of and how to be successful when doing an experiment. In this experimental lesson students design their own experimental investigation and answer questions.
Curated OER
Carbon Monoxide and Population Density
Tenth graders investigate the carbon monoxide level at a fixed latitude to determine if there is a relationship to population density. They download data sets and generate a graph, and find locations using the Earth's coordinate system....
Rochester Institue of Technology
Meal Picking
Scholars explore systems design and its relation to meal picking by using computer simulations to test systems designs. They learn about the Pick-to-Light System and calculate average picking times.
Curated OER
Multiplying Polynomials
Students explore multiplying polynomials. They observe solving polynomials using the standard order of operations, FOIL, and the box method. Throughout the demonstration, students explore strategies of solving word problems such as...
Curated OER
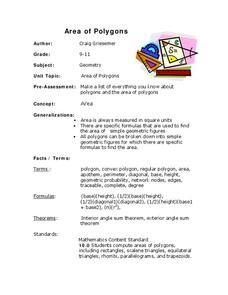
Area of Polygons
Students engage in a lesson that is about the concept of polygons and focuses upon finding the area. They use formulas provided in the lesson in order to solve problems given by the teacher for independent practice. Geometric figures are...
Curated OER
Algebra 1
Students study the functional relationships of a variety of problems. In this functional relationship lesson, students determine the dependent and independent quantities of a given set of data. Students record the data and write it in...
Curated OER
How Simple Is Your Rational Expression?
Investigate simplifying rational expressions. Learners define rational expressions, review how numerators and denominators are polynomials and complete several problems using a checklist to ensure they don't skip any steps. Work can be...
Curated OER
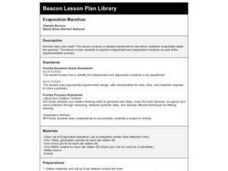
Evaporation Marathon
Students review the steps of the scientific method and participate in a three day experiment. They observe water evaporation over time.
Curated OER
Equations and Inequalities
In this equations and inequalities worksheet, 9th graders solve and complete 10 different problems that include selecting the appropriate letter that complete each problem. First, they determine the solutions of various systems of...
Curated OER
Lesson Plan On Fran Data
Seventh graders investigate the concept of functions and how they are used in the context of the real world while identifying the dependent and independent variables. They graph relations and functions and find the zeros of functions....
Curated OER
Graphing Speed
In this graphing worksheet, students read about independent and dependant variables and learn how to determine speed from the slope of a position vs. time graph. This worksheet has 4 matching, 17 fill in the blank, and 2 problems to solve.


