Curated OER
Worksheet #5: Mixture Word Problems
In this mixture word problem worksheet, young scholars read story problems and determine what information is necessary to solve the mixture problem. They identify the correct solution, graph inequalities, and solve inequality equations....
Curated OER
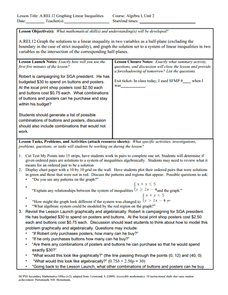
Graphing Linear Inequalities
Eighth graders extend skills for representing and solving linear equations to linear inequalities. Lesson activities build understanding and skill by plotting ordered pairs of numbers that either satisfy or do not satisfy a given...
Curated OER
Inequalities - Absolute Value
Learners graph the absolute value of compound inequalities. Through a demonstration, students discover the meaning of absolute value. They take notes, rewrite opposites, and solve for each variable. Learners complete a worksheet and...
Curated OER
Unit 5 Lesson 01: Graphing on a Number Line
Math masters are introduced to graphing inequalities on a number line. After reviewing inequality symbols, they practice representing them on a worksheet. This simple lesson serves its purpose.
Curated OER
Rainbow Fish Graphing
Students graph different colors of rainbow fish scales after participating in a shared reading of The Rainbow Fish. They answer questions based on the graph. They practice making graphs independently using colored cereal circles.
Curated OER
Graphing Game
Learners explore the concept of graphing ordered pairs. In this graphing ordered pairs instructional activity, students work in teams to play a version of Connect 4. Learners use a Cartesian grid with values -4 to 4 as their Connect 4...
Curated OER
Graphing Linear Equations on the TI
Students graph linear equations on the TI calculator. In this algebra lesson, students rewrite equations in the slope intercept form and use the calculator to graph their problem. They work together to interpret the graphs off of the TI.
Curated OER
Graphing Sunspot Cycles
Students explore sunspots and then graph them to analyze the data. In this sunspot cycles lesson students complete an activity sheet and complete questions.
Curated OER
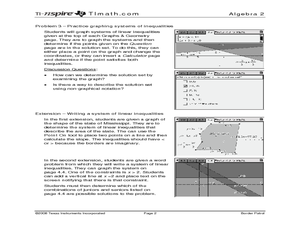
Border Patrol ID: 11603
Incorporate technology in your classroom by teaching your learners how to graph systems of linear inequalities as they apply to an area of land. The lesson plan provides an extension in which students are challenged to write a...
Curated OER
Make a Pass at Me
Students identify different types of functions and units of measurements. In this statistics lesson, students will collect data, graph their data and make predictions about their data. They plot a linear regression graph.
Curated OER
Maximizing Your Efforts
Young scholars graph systems of equation. In this algebra lesson, students find where the lines cross and identify the type of solution. They analyze a graph and write the equation of the line.
Curated OER
What Did It Cost 100 Years Ago?
Students compare prices of good across the century in order to introduce the topic of inflation. They undertand the concepts of inflation and Consumer Price Index (CPI), use online calculators to figure the approximate cost of goods...
Curated OER
Away We Go!
Students study types of transportation. In this transportation lesson, students survey several classes to gather data on how they get to school. Students create a transportation graph.
Curated OER
How Many People Live in Your Household?
Students create a pictograph showing household size for the class.In this data collection and graphing lesson, the teacher guides students through the creation of a concrete object graph, then students analyze and summarize the results.
Curated OER
“My Little Sister Hugged An Ape” | Literature, Math, & More!
Students read the story "My Little Sister Hugged An Ape" and make a list of sensory words from the story. For this interdisciplinary math lesson, students participate in sensory writing, and complete a questionnaire which they will use...
Curated OER
Hassan's Pictures - Linear Programming and Profit Lines
Students graph systems of linear inequalities. In this linear programming and profit lesson, students explore linear programming problems. They graph a feasible region in a linear programming problem and identify the profit lines. ...
Curated OER
Exploring Quadratic Equations
By stretching and translating the parabola given and determining the effects on the equation, students explore finding the vertex and zeros of a parabola and relate them to the equation. Students also view the intercept form to determine...
The New York Times
Fiction or Nonfiction? Considering the Common Core's Emphasis on Informational Text
Nothing aids in comprehension more than an explanation and understanding of why things are done. Address why the Common Core requires the reading percentages that it established and analyze how this affects your readers. Learners read...
Federal Reserve Bank
Barbie in the Labor Force
How have the women's share of the labor force and chosen occupations evolved in the United States over the last century? Using census reports, graphs detailing the gender makeup of the labor force, and analysis of the careers of...
EngageNY
Federal Income Tax
Introduce your class to the federal tax system through an algebraic lens. This resource asks pupils to examine the variable structure of the tax system based on income. Young accountants use equations, expressions, and inequalities to...
Curated OER
Buying Cars/Financing Cars Compound Interest
Provide a real world context in which exponential functions are used to determine a eal world phenomena such as compound interest and exponential growth. This lesson should be taught after learners have mastered the laws of exponents and...
Curated OER
Exploring Complex Roots
In exploring the concept of complex roots, students find the axis of symmetry and roots of parabolas. Then, they discuss what makes a solution complex and how to identify functions with complex roots.
Curated OER
The Absolute Truth
Students solve problems of inequalities and equations. In this algebra lesson, students add, subtract, multiply and divide to solve inequalities. They graph their solutions on a number line.
Curated OER
Equations With Radical Expressions
Students solve systems of equations with radical expressions. After reading real life situation, they translate the problem into algebraic expressions. As a class, students solve quadratic equations and inequalities by graphing and...
Other popular searches
- Graphing Linear Inequalities
- Graphing Inequalities
- Math Graphing Inequalities
- Graphing Compound Inequalities
- Algebra Graphing Inequalities


