Curated OER
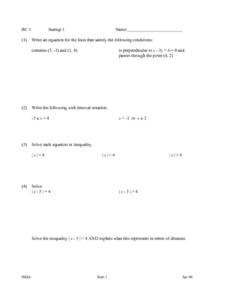
Startup 1: Functions & Interval Notation
In this function worksheet, students write an equation of a line. They solve inequalities and write functions with interval notation. This two-page worksheet contains approximately 20 problems.
Curated OER
Favorite Animals
In this graphing worksheet, learners read and answer questions about a picture graph showing the favorite animals of a group of children
Curated OER
Unit 12 - Version 6.0 - Worksheet 1 - Inequality
In this inequality learning exercise, students solve inequality equations and graph the solution on a number line. They add and subtract fractions with variables and unlike denominators. Students solve absolute variable equations with...
Curated OER
Use the Grid to Answer the Questions
In this algebra activity, students identify the points on a graph and make sure the lines satisfy the conditions placed on the values.
Curated OER
Word Problems
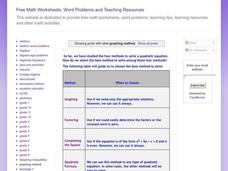
In this algebra worksheet, students are guided to choose the best method to solve problems using graphing, factoring, completing the square, and quadratic formula. There are 4 problems with an answer key.
Illustrative Mathematics
How Many _______ Are In. . . ?
Help your learners gain meaningful understanding of dividing fractions using fraction models. The activity includes nine problems which are sequenced to show how the fraction division algorithm evolves. Have students use graph paper or...
Concord Consortium
Gestation and Longevity
Is the gestation length of an animal a predictor of the average life expectancy of that animal? Learners analyze similar data for more than 50 different animals. They choose a data display and draw conclusions from their graphs.
Los Angeles County Office of Education
Assessment for the California Mathematics Standards Grade 7
In need of an all-inclusive seventh grade math resource? Packed full of the topics necessary for Pre-Algebra the packet includes practice problems with different difficulty levels. It works great for any supplemental use needed in the...
Illustrative Mathematics
Warming and Cooling
Is it too hot to go hiking? This task asks learners to refer to a graph that shows temperature as a function of time and answer five questions about the scenario depicted by the graph. The exercise could be used for instruction to help...
WK Kellogg Biological Station
Plotting Phenology
Finally, a worksheet that involves more than filling in some blanks. Your budding ecologists must graph and analyze three sets of data, then synthesize the information as they think about the impacts of plant reproduction on insects and...
Illustrative Mathematics
Irrational Numbers on the Number Line
There are four irrational numbers that participants need to graph. Pi(π), -(½ x π), and √17 are easy to approximate with common rational numbers. On the other hand, the commentary describing the irrational number 2√2 is not clear. It...
Curated OER
Quiz: Exponential Functions
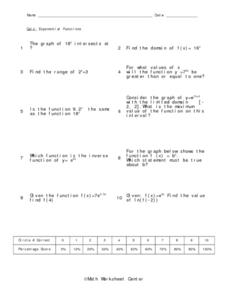
With this quiz, high schoolers solve 10 different problems that include various exponential functions. First, they determine where the graph of a point intersects at what origin. Then, they determine the domain and range. In addition,...
Curated OER
Patterns of Evolution and Selection
Can your young biologists interpret population graphs, match macroevolution patterns and descriptions, and answer multiple choice questions about evolution? Find out with a comprehensive three-page quiz covering some specific examples of...
Curated OER
Worksheet 38-Spring 1996
In this math worksheet, students determine if the definite integral of given functions exist. They use a Taylor polynomial to approximate given values. Students express the arc length of a graph on a polar coordinate system as an integral.
Curated OER
Positive & Negative Numbers
Young mathematicians solve and complete 22 different problems that include using a number line to evaluate. First, they define each of the terms listed. Then, pupils graph each integer on the given number line. They also evaluate each...
Curated OER
Pick's Theorem
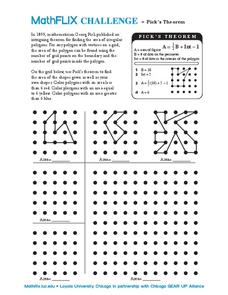
In this Pick's Theorem worksheet, students solve and graph 6 different problems that include using Pick's Theorem to solve. First, they use Pick's Theorem to determine the area of the shapes given as well as their own shapes drawn. Then,...
Curated OER
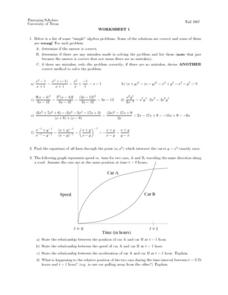
Worksheet 1 - Equation of a Line
In this equation of a line worksheet, students determine the equation of a line, use the distance formula to identify the relationship between two moving objects, and solve inequalities algebraically. This two-page worksheet contains...
Illustrative Mathematics
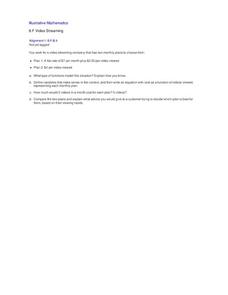
Video Streaming
Your movie fans will be interested in this resource. They will compare video streaming plans. One plan charges a set rate per month and a reduced viewing fee, and the other has a flat rate per each video viewed. Unfortunately, learners...
Curated OER
Pounds of Paper
For this collecting of data worksheet, 2nd graders study and analyze a pounds of paper table in order to solve and answer 6 mathematical questions.
Curated OER
My Test Book: Stem and Leaf Plots
In this math skills worksheet, students solve 10 multiple choice math problems regarding stem and leaf plots. Students may view the correct answers.
Curated OER
Algebraic Equations
In this algebraic equations worksheet, 9th graders solve 10 different problems that include solving various types of algebraic equations. First, they determine the equation of a line and solve the absolute value of an inequality shown....
Curated OER
Academic Algebra II 1st Semester Exam
In the semester exam, high schoolers solve problems dealing the the discriminant of quadratic equations, systems of equations, linear equations and inequalities. Students also simplify radicals, complete squares, and find the inverse of...
Curated OER
Inequality as Distance
In this algebra worksheet, 10th graders calculate the distance between two points using inclusive and exclusive values. They graph their results on a number line. An answer is provided.
Curated OER
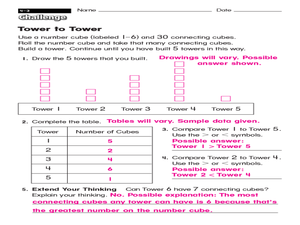
Building Towers with Number Cubes
In this building towers with number cubes activity, 2nd graders build number cube towers by rolling a dice, then complete a data chart to compare the number of cubes in each tower.
Other popular searches
- Graphing Linear Inequalities
- Graphing Inequalities
- Math Graphing Inequalities
- Graphing Compound Inequalities
- Algebra Graphing Inequalities


