Curated OER
Charting Historical Gas Prices
Students investigate the historical and current prices of a gallon of gasoline. Using an online tool, they calculate the inflation-adjusted cost of gasoline over the years, and create a graph to demonstrate the actual cost vs. the...
Curated OER
Fin, Feathers, or Fur?
Students learn how to classify animals. In this animal characteristics lesson, students read Granddad's Animal Alphabet Book, brainstorm a list of different kinds of animals, and determine their characteristics; fur, feathers or scales....
Curated OER
Characteristics of Exponential Functions
What can an upper grader do with an exponential function? They can solve and graph it, identify its important characteristic, and differentiate graphs based on shifts in graph bases that are greater or less than one. This 45 minute...
Curated OER
Walking Home II
Students explore the relationship between distance and time. They analyze a situation involving distance traveled in a given period of time, represent the situation graphically and algebraically, and discuss the concept of slope as a...
Curated OER
Glacial Striation Investigation
Students operate a GPS unit to investigate the direction of glacier movement. They describe the motion of glacier movement by interpreting a graph. Students explain how scientists use glacier striations to determine glacier movement.
Curated OER
Coordinate Connections
Sixth graders complete several activities that involve coordinates and graph paper. They visualize and identify geometric shapes after applying transformations on a coordinate plane. Finally, 6th graders draw and label a coordinate...
Curated OER
Cramer's Rule ID: 8793
Mathematicians are introduced to Cramer’s Rule and use it to solve three systems that have one solution, no solutions, and an infinite number of solutions. Learners use TI-Nspire to graph the systems to verify their answers and...
Curated OER
Aboriginal Statistics
Fourth graders analyze statistics of Native Americans by creating graphs. For this data analysis lesson, 4th graders define different statistical terms and practice finding those statistics from groups of numerical information...
Alabama Learning Exchange
The Grouchy Ladybug
Learners listen to the book, "The Grouchy Ladybug" by Eric Carle and sequence the events in the story. Using a graph, they draw and color the animals that the ladybug meets next to the corresponding time from the story, and conduct...
Curated OER
How Texas is Planning To Manage Its Water
Students research water management strategies in Texas. They analyze projected demand for water in the year 2050, interpret graphs and tables and then discuss the data as part of a written report. They research and map the locations of...
Curated OER
Frog and Toad are Friends
Students view a 30-minute video lesson to discover information about the characteristics of frogs and toads. They then transform themselves into frogs and participate in a Jumping Frog Jubilee. They work in groups of three to measure and...
Curated OER
Which Method Will You Choose? Finding Solutions to Systems of Equations.
Ninth graders investigate systems of linear equations. In this Algebra I lesson plan, 9th graders determine which method is the best for solving a systems: graphing, substitution, or elimination. Students choose...
Curated OER
Function or Not a Function
Graphing linear equations on the TI is easy! Through examination of graphs and identification if it is a function or not, this instructional activity can relate to the real world.
Curated OER
College Costs are on the Rise
Learners examine college costs in different states. In this college cost lesson, students create a table and determine the average cost of college for the states listed. They organize the data into measurement categories. Learners create...
Curated OER
Giving it 100%
Learners build knowledge about the number relationships between decimals and percents as it relates to converting decimals into percents. In this decimal and percent lesson, students recognize equivalent forms of fractions,...
Michigan Sea Grant
Water Quantity
It may be tricky for a young mind to conceptualize that less than 1% of all water on earth is useable for humans to drink. Simulating the amount of fresh water available on earth by removing measured amounts of water from a five-gallon...
Curated OER
Angle Relationships
Tenth graders explore the angle relationships that exist when two lines intersect. For this geometry lesson, 10th graders estimate the measure of given angles and use their graphing calculator tools. Students use this knowledge to find...
Curated OER
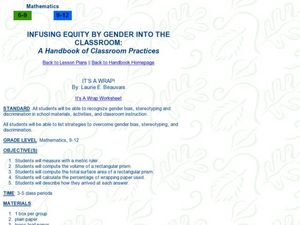
Infusing Equity in the Classroom by Gender
Students investigate the idea of gender descrimination in the classroom. In this algebra lesson, students collect data in stereotyping, and gender bias in the classroom, school materials and activities. They graph and analyze their...
Curated OER
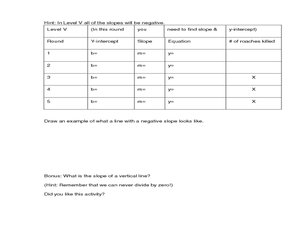
Cockroach Slope
Students identify the slope of linear functions. In this slope lesson, students collect data and graph it. They write equations with no more than two variables and use technology to explain their data.
Curated OER
Solving Systems using Elimination
Using elimination to find the point of intersection of two lines, students learn to solve systems of equation. They graph their solutions and use the TI to verify the solution.
Curated OER
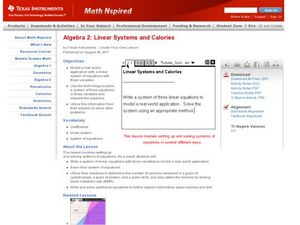
Linear Systems and Calories
Students define and graph properties of linear equations. In this algebra lesson, students write systems of equations to represent functions. They relate linear equations to the real world.
Curated OER
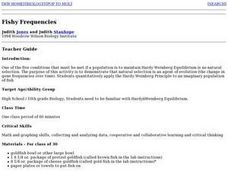
Fishy Frequencies
Tenth graders demonstrate that natural selection is an agent of evolution. They quantitatively apply the Hardy-Weinberg Principle to an imaginary population of fish. They utilize math and graphing skills, collecting and analyzing data,...
Curated OER
Fit With Fiber
Sixth graders investigate the nutritional value of different types of cereal. They take a survey of students that ate breakfast and create a circle graph with the results. Students examine the nutritional information on the sides of the...
Curated OER
Absolute Value
In this algebra worksheet, young scholars solve absolute value equations through graphing and algebraically. There are 50 questions.
Other popular searches
- Graphing Linear Inequalities
- Graphing Inequalities
- Math Graphing Inequalities
- Graphing Compound Inequalities
- Algebra Graphing Inequalities


