National Nanotechnology Infrastructure Network
The Effects of Gold and Silver Nanoparticles on Brine Shrimp: A Toxicology Study
Who doesn't love gold and silver? Brine shrimp, that's who! Learners conduct an experimental lesson to monitor the toxicity of gold and silver nanoparticles on brine shrimp. They synthesize solutions to expose the brine shrimp to and...
Population Connection
A Demographically Divided World
Did you know that birth and life rates vary across the world? The resource, the second in a six-part series, discusses just how demographics differ across countries and why it might be the case. Scholars complete worksheets, watch...
Curated OER
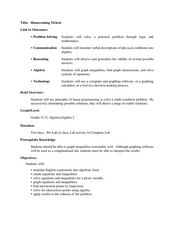
Homecoming Tickets
Students solve word problems using systems of equation. In this algebra lesson, students use computer and graphing to graph and analyze their solution. They solve system involving inequalities.
Curated OER
Introducing Linear Terminology
Ninth graders graph linear equations and inequalities in two variables and then, they write equations of lines and find and use the slope and y-intercept
of lines. They use linear equations to model real data and define to define the...
Curated OER
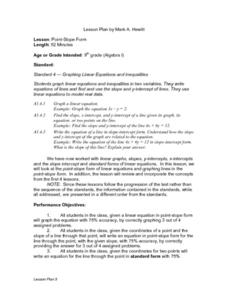
Point-Slope Form
Ninth graders explore the point-slope form of linear equations and graph lines in the point-slope form. After completing the point-slope equation, they identify the slope of a line through a particular point. Students explain the...
Curated OER
Discovering Growth Patterns
Students explain the differences between linear (arithmetic) and exponential (geometric) growth. They use worksheets imbedded in this lesson to help them make predicitions and graph data points.
Curated OER
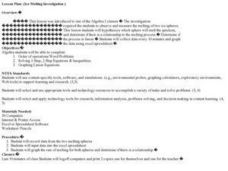
Ice Melting Investigation
Pupils conduct an ice melting investigation in which they observe and measure the melting of two ice spheres. They develop a hypothesis as to which sphere will melt the fastest, collect data every ten minutes, and graph the data using...
Curated OER
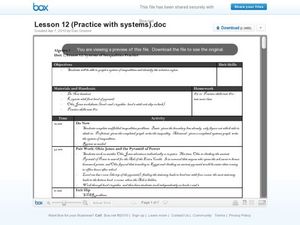
Practice with Systems of Equations
Students solve systems of inequalities. In this algebra lesson plan, students solve a system of equation, using substitution, linear combinations and graphing. They identify the number of solution each system produce as infinitely...
Curated OER
College Prep Worksheet Chapter 2, 2.1-2.4, 2.6, 2.8 & 7.5
In this algebra worksheet, learners identify the coefficient, simplify expressions, solve algebraic equations, and graph inequalities. This worksheet contains 93 equations, with an answer key.
Curated OER
FCAT Real World Solving Linear Equations/Systems
Pupils relate real life situation to the equations, graphs and inequalities. They model real life scenarios using matrices and draw conclusions from their data. This lesson plan is aligned with FCAT.
Curated OER
Systems of Equations
Pupils solve inequalities and systems of equations. In this algebra lesson, students use substitution and elimination as they solve algebraic systems. They use graphing and a table to support their solutions.
Curated OER
Polynomial Multiplication
Students review information about how to multiply polynomials and then work in pairs to complete a worksheet. They use graphing calculations to help them solve their math problems.
Curated OER
Comparing Exponential and Power Functions
Students compare and contrast exponential and power functions. In this precalculus lesson, students identify the value of x, using the graph as a visual. They compare functions with base of greater than one, to base of less than one.
Curated OER
Determination of Tensile Stress-Strain Common Properties in Materials
Students demonstrate the relationship between stress and strain, then graph stress-strain curves for various common materials. Students interpret graphed results and discuss differences in mechanical properties of materials.
Curated OER
Linear Systems
Students solve and graph linear equations. In this algebra lesson, students solve systems of equations using elimination and substitution. They graph their answer and identify the point of intersection.
Curated OER
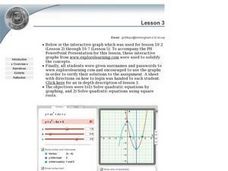
Lesson 3: The Quadratic Equation
Students explore quadratic equations. They use interactive graphs (on the Internet) to verify and solve solutions. Students solve quadratic equations by using square roots. Students examine examples of inequalities.
Curated OER
The Effect of Rain on Morning Temperatures
Eighth graders study the effects of the water cycle. They create a graph of the air temperature versus solar radiation on a rainy and clear 24 hour period using data from a provided link. Afterward, they answer questions to determine the...
Curated OER
What is My Favorite Apple?
Students decide on their favorite apple and together make a graph.
Curated OER
Prime and Composite Numbers, Prime Factorization
Middle schoolers research prime and composite numbers. With a partner, students use graph paper to draw rectangles of various sizes. They list the dimensions of rectangles and discuss how the dimensions relate to the factors of each...
Curated OER
Bodacious Buttons
First graders graph a data set. Given a set of buttons, 1st graders sort them into categories using specific attributes. They graph the number of buttons in their set based on their attributes using a variety of graphs. Students share...
Curated OER
Specific Heat and Insulation
Students measure the air and soil temperatures at designated times. They graph the temperatures of each on one piece of graph paper with different colors. Students compare the information for the two line plots and analyze their results...
Curated OER
Choosing a Summer Job
What did you do over your summer vacation. Young wage earners must compare summer job options, and determine when each job earn the same amount and what that amount be. This be done by creating, graphing, and solving systems of...
Curated OER
Linear Functions: Are You Ready for the REAL World?
students emulate a real world problem and model it with mathematics working in a small group. Observe and facilitate discussion as the groups use various strategies, such as (graphs, brainstorming, tables, and dialogue.
Curated OER
Jelly Belly: What a Wonderful "Bean"!
Pupils explore how jelly beans are produced. They discuss the origins of the jelly bean and view a video about how jelly beans are prepared, tested, shaped, finished, and shipped and estimate the amount of jelly beans in a jar and sort...
Other popular searches
- Graphing Linear Inequalities
- Graphing Inequalities
- Math Graphing Inequalities
- Graphing Compound Inequalities
- Algebra Graphing Inequalities


