Illustrative Mathematics
Telling a Story With Graphs
Turn your algebra learners into meteorologists. High schoolers are given three graphs that contain information about the weather in Santa Rosa, California during the month of February, 2012. Graph one shows temperatures, graph two...
Virginia Department of Education
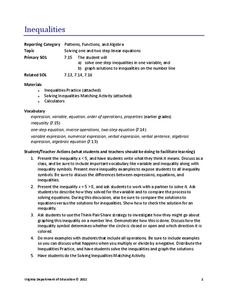
Inequalities
Not all resources are created equal — and your class benefits! Scholars learn how to solve one-step inequalities using inverse operations. They complete an activity matching inequalities to their solutions.
EngageNY
Finding Systems of Inequalities That Describe Triangular and Rectangular Regions
How do you build a polygon from an inequality? An engaging lesson challenges pupils to do just that. Building from the previous lesson in this series, learners write systems of inequalities to model rectangles, triangles, and even...
Project Maths
Inequalities
Which number is bigger? Using a variety of activity sheets, this unit starts with the basics of inequalities and progresses through solving compound linear inequalities. Problems cover the range of inequalities including inequality word...
West Contra Costa Unified School District
Connecting Graphing and Solving Absolute Value Equations and Functions
Can you solve an equation graphically? Absolutely! This Algebra II lesson makes the connection between solving an absolute value equation and graphing two functions. Graphing absolute value functions is presented through the process of...
Curated OER
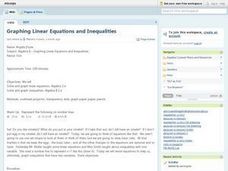
Graphing Linear Equations and Inequalities
Students discuss methods to solve equations and inequalities with one variable. As a review, they write Addition and Subtraction properties of equality and Multiplication and Division properties of equality. Students graph points, write...
EngageNY
Solution Sets for Equations and Inequalities
How many ways can you represent solutions to an equation? Guide your class through the process of solving equations and representing solutions. Solutions are described in words, as a solution set, and graphed on a number line....
EngageNY
Interpreting Quadratic Functions from Graphs and Tables
Seeing functions in nature is a beautiful part of mathematics by analyzing the motion of a dolphin over time. Then take a look at the value of a stock and maximize the profit of a new toy. Explore the application of quadratics by...
Curated OER
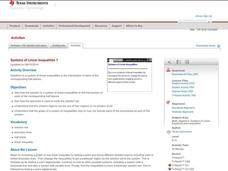
Systems of Linear Inequalities
The class solves systems of linear inequalities. They graph lines and identify the point of intersection.They graph lines and identify the boundary that represent the solution and solution set.
Curated OER
Graphing Inequalities
Students solve inequalities and graph. In this algebra lesson, students rewrite inequalities in the slope intercept form and graph using the slope and intercept. They shade the correct side of the line using greater than or less than as...
Curated OER
Graphing Inequalities in One Variable
Students graph inequalities on a number line. In this algebra activity, students solve linear and compound inequalities and graph them on a number line. They write an inequality given the number line with the solution on it.
Curated OER
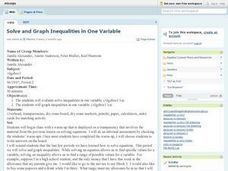
Graphing Inequalities in Equations
Can a person solve and graph inequalities in one variable? Sounds impossible but it's not! Young mathematicians solve and graph inequalities in algebraic equations. They find a range of possible values for a variable as they solve...
Curated OER
Inequalities in Two Variables
In this algebra worksheet, students solve and graph 3 linear inequalities on coordinate systems. They solve and graph 3 systems of linear inequalities on a coordinate grid.
Curated OER
Linear Inequalities in One and Two Variables: Rays and Half Planes
Define rays and half planes, including the concepts of boundary lines and prerequisite knowledge of coordinate planes. Given linear inequalities in one and two variables, your class will compare the differences. They will also graph...
Curated OER
Intersections, Unions, and Compound Inequalities
In this algebra worksheet, students graph inequalities on number lines. Two problems are written in interval notation. The other five problems require students to graph and then write in interval notation.
Curated OER
Inequalities 7.3
Graph inequalities and discuss the difference in their slopes. Learners observe rate of change as they compare linear, quadratic, and cubic functions.
Curated OER
Two-Variable Linear Inequalities
Here is an engaging lesson on solving equations with two variables. Have the class rewrite linear equations in the slope intercept form, y=mx + b. They graph the lines using the slope and y-intercepts.
Curated OER
Graphing Names in Historic Cemetery
Young scholars collect information from headstones about names of the deceased in their local community. They determine the most common names and graph them. They discuss their findings with the class.
Virginia Department of Education
Graphing Systems of Inequalities
Apply systems of inequalities to a real-world problem. Here, scholars learn to graph solutions to systems of linear inequalities. To finish the lesson, they solve a problem involving burgers and cheeseburgers using a system of inequalities.
Virginia Department of Education
Solving and Graphing Inequalities
You can't go wrong with a instructional activity that involves candy! Learners solve and graph one-variable inequalities and use candy to graph the solution. Individuals associate open circle graphs with life savers and closed circle...
Willow Tree
Solving Inequalities
What does solving an inequality have in common with solving an equation? Almost everything! A math resource focuses on the one exception. The examples lead learners through the steps of solving an equality when multiplying or...
Curated OER
What Functions do Two Graph Points Determine?
Your algebra learners write linear, exponential, and quadratic equations containing the same two graph points in this collaborative task.
Virginia Department of Education
Inequalities
Compare graphing an inequality in one variable on a number line to graphing an inequality in two variables on a coordinate plane. Young mathematicians work on a puzzle matching inequalities and their solutions. They then complete a...
EngageNY
Writing and Graphing Inequalities in Real-World Problems
Inequalities: when one solution just doesn't suffice. Individuals learn to write inequalities in real-world contexts and graph solution sets on the number line. All inequalities in the lesson are of the form x < c or x < c.
Other popular searches
- Graphing Linear Inequalities
- Graphing Inequalities
- Math Graphing Inequalities
- Graphing Compound Inequalities
- Algebra Graphing Inequalities


