EngageNY
Modeling a Context from a Verbal Description (part 1)
When complicated algebraic expressions are involved, it is sometimes easier to use a table or graph to model a context. The exercises in this lesson are designed for business applications and require complex algebraic...
Southwestern Medical Center
Field Epidemiology: Investigation of an Unknown Disease
More than 90 percent of the people in a building have come down with an illness, and it is your job to investigate. Teachers give scientists the data needed to decide what is important and how they can solve the mystery....
Mathematics Assessment Project
Functions
Studying function means more than simply learning a formula. Learners must use functions to think through four problems and find solutions. Each task utilizes a different concept from a study of functions. Class members might...
Curated OER
Solving Systems of Inequalities
In this algebra worksheet, students solve systems of inequality using the graphing method. There are 5 questions with lots of examples and an answer key.
Curated OER
Two Step Inequalities
In this algebra learning exercise, 11th graders solve two step algebraic inequalities and graph their solution on a number line. This learning exercise contains 20 graphing problems with an answer key.
Curated OER
Absolute Value Inequalities
For this algebra worksheet,students solve inequality equations and graph their answers on a number line. There are 22 questions with an answer key.
Curated OER
Solving Inequalities
In this algebra worksheet, students solve inequality equations and graph them on the number line. There are 22 questions with an answer key.
Curated OER
Worksheet 2.4 Introduction to Inequalities
For this math worksheet, students read the examples that focus upon the concept of inequalities. The examples include the graph of the line.
Jude Mphoweh
Coordinates
This coordinate graphing lesson gives your young graphers practice graphing points on these rectangular coordinate grids.
Curated OER
Solving Inequalities
In this solving inequalities worksheet, 9th graders solve 15 different inequalities. First, they use the addition, subtraction, multiplication, and division properties of inequalities to solve linear inequalities. Then, students draw a...
Curated OER
Graphing Linear Inequalities
In this graphing linear inequalities worksheet, students graph 1 linear inequality. Students walk through each step to graphing the inequality and shading the appropriate region on the graph.
Illustrative Mathematics
Peaches and Plums
According to the resource graph, which costs more: peaches or plums? Algebra learners compare two proportional relationships and then throw in a banana. Leaving out the scale helps learners become intuitive about graphing.
Curated OER
Evaluating Expressions
In this evaluating expressions worksheet, students solve and complete 50 various types of review problems. First, they complete each sentence and define the listed terms. Then, students evaluate each expression for the given values. They...
West Contra Costa Unified School District
Slope-Intercept Sort
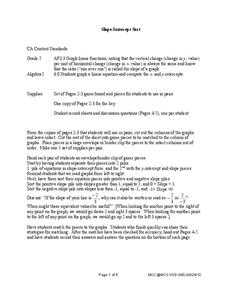
What's so special about slope? Pupils first match cards with slope and y-intercept to graphs of linear equations. They continue the lesson by matching equations in slope-intercept form to the same graphs.
Illustrative Mathematics
Fishing Adventures 2
This resource is part of a series which expects participants to be familiar with graphing inequalities on a number line. It is a word problem that asks your class to graph a discrete solution set and interpret it in the context of an...
Curated OER
Linear Programming
In this algebra worksheet, students calculate the maximum and minimum of a shaded region. They identify the boundaries and their vertices's. There are 2 problems.
Los Angeles County Office of Education
Assessment for the California Mathematics Standards Grade 2
Test scholars mathematic skills with an assessment addressing addition, subtraction, multiplication, place value, measurement, geometric shapes, expanded notation; and their ability to compare numbers, write number...
Curated OER
Reading Tally Charts #2
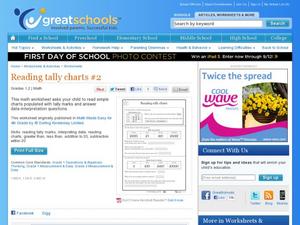
Keep count with tally marks! First graders practice reading tally marks with this straightforward learning exercise. They work with interpreting data from a chart, as well as working with addition and subtraction under 20. A great math...
Inside Mathematics
Population
Population density, it is not all that it is plotted to be. Pupils analyze a scatter plot of population versus area for some of the states in the US. The class members respond to eight questions about the graph, specific points and...
EngageNY
Multi-Step Problems in the Real World
Connect graphs, equations, and tables for real-world problems. Young mathematicians analyze relationships to identify independent and dependent variables. These identifications help create tables and graphs for each situation.
Flipped Math
Unit 3 Review: Systems of Equations
More practice makes perfect. A review packet helps pupils remind themselves of the content of the unit. They determine whether points are solutions to linear equations, graph systems of equations and inequalities, and solve systems of...
EngageNY
Mid-Module Assessment Task: Grade 7 Mathematics Module 3
Lesson 16 in the series of 28 is a mid-module assessment. Learners simplify expressions, write and solve equations, and write and solve inequalities. Most questions begin as word problems adding a critical thinking component to the...
Inside Mathematics
Quadratic (2006)
Most problems can be solved using more than one method. A worksheet includes just nine questions but many more ways to solve each. Scholars must graph, solve, and justify quadratic problems.
Curated OER
Equations and Inequalities
In this equations and inequalities worksheet, 9th graders solve and complete 2 multiple choice problems. First, they read and identify the graph shown representing a given equation. Then, students determine the graph that best represents...
Other popular searches
- Graphing Linear Inequalities
- Graphing Inequalities
- Linear Inequalities Graph
- Graph Inequalities
- Combined Inequalities Graph
- Graph Quadratic Inequalities
- Math Graphing Inequalities
- Graphing Compound Inequalities
- Graph System of Inequalities
- Solve and Graph Inequalities
- Algebra Graphing Inequalities


