Curated OER
Interpreting Graphs: Temperate Climates
For this interpreting graphs worksheet, students read a graph containing data of rainfall and temperature, then complete 18 questions, interpreting the data.
Curated OER
Which Graphs are Functions?
In this graphing worksheet, students use the vertical line test to determine if graphs are functions. This two-page worksheet contains 8 problems.
Curated OER
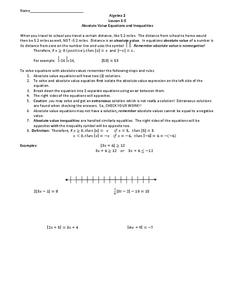
Absolute Value Equations and Inequalities
In this algebra instructional activity, students solve equations and inequalities. They graph their solution set on a number line. There are 16 questions with an answer key.
Curated OER
Absolute Value Equations and Inequalities
In this Algebra II activity, 11th graders solve and graph the solutions to absolute value equations and inequalities. The two page activity provides explanation and examples in addition to sixteen practice questions. Answers are not...
Curated OER
Solving Inequalities with Fractional Coefficients
For this algebra worksheet, learners solve inequalities by factoring. They graph their solution on a number line. There is an answer key.
Curated OER
Unit 4: Worksheet 4: Functions and Graphs
In this function and graph activity, students read and interpret maps and graphs. They write an equation, define variables and solve the equation. Students solve diamond problems and use the distributive property to solve equations. ...
Curated OER
Investigating Parabolas
In this investigating parabolas worksheet, 9th graders solve and graph 7 different problems that include graphing various equations that represent parabolas. First, they sketch their graphs to each problem. Then, students determine what...
Curated OER
Algebra 2 Test
In this algebra worksheet, students solve problems by graphing inequalities, finding the slope of a line and identifying functions. This is a review of chapter 2 on an algebra test. There are 21 questions.
Curated OER
Graphing Inequalities
In this graphing inequalities worksheet, 6th graders solve and complete 24 different types of problems. First, they draw a graph for each given inequality. Then, students solve for each equation.
Curated OER
Graphing Inequalities
In this graphing inequalities worksheet, students create graphs of algebraic expressions containing inequalities. This two-page worksheet contains explanations and examples prior to the exercise. The first page is a contains...
Curated OER
Graphs, Equations and Inequalities
In this inequalities worksheet, 6th graders solve and complete 30 various types of problems. First, they calculate and write down a whole number for each equation. Then, students determine the gradient of a line with a given equation....
Achieve
Rabbit Food
Keep your pets slim, trim, and healthy using mathematics! Pupils use a linear programming model to optimize the amount and type of food to provide to a pet rabbit. They model constraints by graphing inequalities and use them to analyze a...
Virginia Department of Education
Equations of Lines
Scholars connect slope-intercept form and standard form to the values of m and b by first matching a set of cards that have slope-intercept form, standard form, values of m, values of b, and graphs of linear equations. They then play a...
Achieve
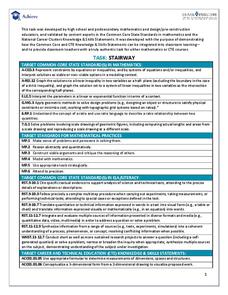
Stairway
It's the stairway to learning! Scholars research all aspects of building a staircase. Using information from building codes, they write and graph a system of inequalities to analyze the constraints. The completed project is a scale model...
Virginia Department of Education
Rational Functions: Intercepts, Asymptotes, and Discontinuity
Discover different patterns by making connections between a rational function and its graph. An engaging instructional activity asks scholars to explore the behavior of different rational functions. Groups discover a connection between...
EngageNY
Geometric Interpretations of the Solutions of a Linear System
An intersection is more than just the point where lines intersect; explain this and the meaning of the intersection to your class. The 26th segment in a 33-part series uses graphing to solve systems of equations. Pupils graph linear...
Curated OER
Less and More Scavenger Hunt
Send your scholars on a measuring scavenger hunt with this interactive worksheet! They use a graphic organizer to record their findings as they search for items which are less than, more than, or just about one inch long. For each, they...
Curated OER
Narrow Corridor
Buying a new sofa? Learn how to use the Pythagorean Theorem, as well as algebra and graphing techniques, to determine whether the sofa will fit around a corner (which I'm sure you'll agree is a very important consideration!).
Inside Mathematics
Coffee
There are many ways to correlate coffee to life, but in this case a worksheet looks at the price of two different sizes of coffee. It requires interpreting a graph with two unknown variables, in this case the price, and solving for those...
Concord Consortium
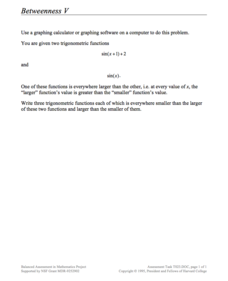
Betweenness V
Take a unique approach to study the graphing of trigonometric functions. Young scholars consider two sine functions and write three functions that will lie between the two given. They use a graphing utility to assist in their explorations.
Concord Consortium
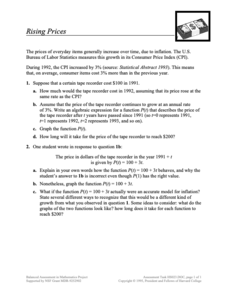
Rising Prices
What will that cost in the future? The scenario provides pupils with a growth as a Consumer Price Index. Learners create functions for a given item to determine future prices and graph them. Class members then compare their functions to...
Concord Consortium
Betweenness II
Read between the curves ... quadratic curves! Young scholars analyze the graphs of two quadratic functions by writing their own function whose outputs are between the two given. They then consider intersecting quadratic functions and...
MCAS Mentor
Number Sense and Operations
In this number sense and operations worksheet, learners solve 15 different types of problems that include reading number lines and solving inequalities. First, they write the scientific notation of various numbers given. Then, pupils...
Curated OER
Birds' Eggs
More than just data, scatter plots are full of information that can be used to answer a variety of questions. This lesson uses a plot with information about bird egg sizes to answer questions about the relationship between length and...
Other popular searches
- Graphing Linear Inequalities
- Graphing Inequalities
- Linear Inequalities Graph
- Graph Inequalities
- Combined Inequalities Graph
- Graph Quadratic Inequalities
- Math Graphing Inequalities
- Graphing Compound Inequalities
- Graph System of Inequalities
- Solve and Graph Inequalities
- Algebra Graphing Inequalities


