Lane Community College
Review Sheets: Beginning Algebra
This jumbo worksheet contains everything you need to get through Pre-Algebra. Begin with simple expressions, and end with linear functions and polygons. There are multiple problems for each topic to make sure those skills are set.
Curated OER
Analyzing Graphs
For this statistics and probability worksheet, students analyze frequency distribution tables or histograms and box and whisker plots. The two page worksheet contains four multiple choice questions. Answers are included.
Curated OER
Graphing Linear Inequalities
In this algebra worksheet, students graph inequality linear graphs and shade using a test point. There are 14 problems with an answer key.
Curated OER
Linear Inequality
Seventh graders solve and complete 12 different problems that include graphing and using multi-steps to solve. First, they solve each multi-step linear non-compound inequality with the given values. Then, pupils graph each solution given...
Curated OER
Mat 0024 Section 1.4: Signed Numbers and Decimals
This activity has a little of everything. Compare fractions, determine if numbers are less than, greater than, or equal to. Then practice lining up the decimals to add and subtract decimal numbers. Then multiply decimals remembering to...
Tech Know Teaching
6th Grade Constructed Response Question
Graphs, charts, maps, diagrams. Reading and comprehending informational text is far more than just decoding the words on a page. Here's a packet that provides young readers with practice answering constructed response questions using...
Curated OER
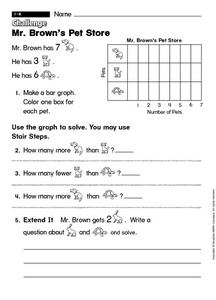
Mr. Brown's Pet Store
For this early childhood problem solving worksheet, students make a bar graph with the provided information and then use the graph to solve 4 problems.
Curated OER
Integrated Algebra: State Exam
In this integrated algebra worksheet, students solve problems related to topics covered in algebra for the entire year. Topics include, but are not limited to, inequalities, probability, functions, interval notation, exploring graphs,...
Curated OER
Integrated Algebra Final Exam
In this integrated algebra worksheet, students solve problems involving system of equations, quadratic equations, inequalities, surface area, and radicals. This 28-page worksheet contains 39 multi-step problems.
Curated OER
Math for Fourth Grade: Statistical Charts
In this math for fourth grade statistical charts activity, 4th graders answer 7 multiple choice questions in standardized test format about data, charts and graphs.
Curated OER
Solving Quadratic Systems
In this solving quadratic systems worksheet, 11th graders solve 8 different problems. First, they solve each system of equations algebraically. Then, students solve each system of inequalities by graphing on the grids provided for each...
Curated OER
Write Larger Numbers in Words or Figures
In this reading a bar graph worksheet, students identify numbers to answer word questions. In this short answer worksheet, students answer five questions.
Curated OER
Pictures of Data: Post Test
In this data worksheet, students answer multiple choice questions about charts and graphs. Students answer 10 questions total.
Curated OER
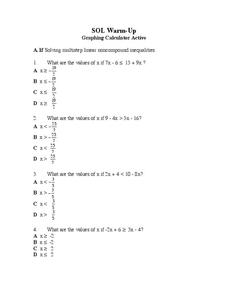
SOL Review
For this SOL worksheet, students solve inequalities, identify equivalent fractions and graph polynomial functions. They find the geometric means and compute average rates. This eight-page worksheet contains 20 multiple-choice problems.
Curated OER
Profit and Loss
In this reading a graph worksheet, students analyze a graph to determine profit and loss. Students answer comprehension questions about the information in the graph.
Curated OER
Restaurant Income and Expenditure
In this reading a graph worksheet, students analyze a graph and answer comprehension questions.
Curated OER
Frequency Tables and Histograms
In this graph worksheet, 5th graders study the data presented on a bar graph. Students then respond to 4 short answer questions using the information that has been provided.
Curated OER
Inequality Shading Investigation
In this inequality worksheet, students graph the inequality of a line. They list ten integer coordinates that lie on the grid. Students explore their findings and answer thought questions. They shade the graph to indicate answers. ...
Curated OER
Analysis Review Sheet
In this analysis review activity, students solve 3 complex inequalities, graph 2 absolute value inequalities, and write the equations for altitudes and tangent lines for 4 problems.
Virginia Department of Education
Factoring for Zeros
Relate factors to zeros and x-intercepts. Scholars first graph quadratics in both standard and factored forms to see that they are the same. They go on to use the graphs to see the relationship between factors and x-intercepts.
Balanced Assessment
Survey Says
Examine statistical data that shows an overlap in responses. The data tallies over 100% and learners interpret this data characteristic. They then create a graph to represent the data.
Curated OER
Worksheet #5: Mixture Word Problems
In this mixture word problem worksheet, students read story problems and determine what information is necessary to solve the mixture problem. They identify the correct solution, graph inequalities, and solve inequality equations. Nine...
Curated OER
Line Plot Touchdowns
In this line plots worksheet, students read the number of touchdowns that were scored in Super Bowl Games from 1990-2000. Students use the line plots to answer the questions.
Curated OER
Linear Inequalities
In this algebra worksheet, students solve linear inequalities. They graph their solution on a coordinate plane. There are 6 questions with answer key.
Other popular searches
- Graphing Linear Inequalities
- Graphing Inequalities
- Math Graphing Inequalities
- Graphing Compound Inequalities
- Algebra Graphing Inequalities


