Illustrative Mathematics
Average Cost
Here is an activity that presents a good example of a function modeling a relationship between two quantities. John is making DVDs of his friend's favorite shows and needs to know how much to charge his friend to cover the cost of making...
Virginia Department of Education
Algebra Tiles and Solving Equations
Young mathematicians solve linear equations by drawing models of algebra tiles using colored pencils. To finish, they solve the same equations algebraically and check their answers using a graphing calculator.
Virginia Department of Education
Road Trip
Help plan a road trip with linear equations. Scholars consider two different rental car companies and write equations representing the cost for each company. They graph the system of equations to determine the conditions under which each...
Miami University
Chapter Nine Worksheet: Monopoly
Advanced economics pupils analyze a series of graphs, data sets, and profit scenarios all related to monopolies and marginal revenue. They read through the background information, complete a graph using the data provided, and justify...
Willow Tree
Box-and-Whisker Plots
Whiskers are not just for cats! Pupils create box-and-whisker plots from given data sets. They analyze the data using the graphs as their guide.
Illustrative Mathematics
The Djinni’s Offer
The djinni in this resource offers gold coins. Learners use the properties of exponents to make their decision as one offer increases exponentially. This makes a great group project. As the commentary suggests, start by having groups...
Curated OER
Polynomials and Linear Factors
This algebra activity reviews writing polynomials in standard form from factored form, looks at the graphs of polynomials of degree higher than two, and identifies the zeros of polynomials using the Factor Theorem and Fundamental Theorem...
West Contra Costa Unified School District
Correlation and Line of Best Fit
Computers are useful for more than just surfing the Internet. Pupils first investigate scatter plots and estimate correlation coefficients. Next, they use Microsoft Excel to create scatter plots and determine correlation coefficients and...
Curated OER
TI Calculator
In this algebra worksheet, 11th graders troubleshoot the TI-83/84 graphing calculator. They review the proper process to use when entering equations and fractions into the calculator. There are 4 example problems worked out.
Virginia Department of Education
Radical Equations
Provide students with the skill for how to examine algebraic and graphical approaches to solving radical equations. Learners solve various radical equations involving square root and cube root expressions. They first solve using...
Curated OER
Review Set
The topics covered in these multiple choice questions are about atomic structure and bonding, state configurations, pressure and solution concentration, and energy graphs. This is a midterm review which could be used with the whole...
Illustrative Mathematics
Security Camera
A different-than-normal problem that allows learners to practice their reasoning to find an answer. The problem bases itself off a graph drawing of a store that needs to install security cameras. The challenge is to find which placement...
Mathed Up!
Negative Scale Factor
Class members investigate the effect of a negative scale factor dilation on coordinate shapes as they watch a short video that shows an example of a geometric figure undergoing a dilation with a negative scale factor. Learners then try a...
Corbett Maths
Average Rate of Change
Simply find the slope to find the average rate of change. A short video provides the definition of the average rate of change. Using the definition, pupils calculate the average rate of change to solve problems that cover finding average...
Curated OER
Tracing Worksheet
In this geometry activity, students explore graphing characteristics. Students complete seven short answer and problem solving questions about graphing and whether or not one can be traced.
Curated OER
Integers and the Number Line
In this integers and number line worksheet, students complete 10 problems by naming the set graphed. Students graph 6 number sets. Then students answer 6 sum problems.
Curated OER
Integers and the Number Line
In this integer and number line worksheet, students in 6 problems name the graphed set of numbers. Students then graph 8 number sets.
Curated OER
Properties of Curves
In this Calculus worksheet, learners use a graphing calculator to boost their understanding of functions and their graphs as they examine the properties of curves. The forty-two page worksheet contains one hundred problems. Answers are...
Curated OER
Introduction to functions
In this functions worksheet, students plot points on a graph according to the rule. Students plot 7 points on each of the 2 graphs given to them.
Curated OER
College Prep Algebra, Worksheet Chapter 3, 2.5, 2.7, 3.1- 3.4
In this algebra worksheet, students translate 39 word problems into algebraic terms and solve them. They complete 42 problems about coordinate graphing, working with ordered pairs, slop, and equations of lines.. They make 2 scatter grams...
Curated OER
Word Problems
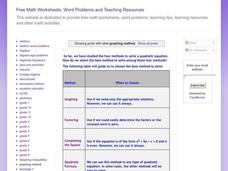
In this algebra worksheet, students are guided to choose the best method to solve problems using graphing, factoring, completing the square, and quadratic formula. There are 4 problems with an answer key.
Curated OER
Favorite Pets
For this tallying and graphing worksheet, students use the tallied graph for favorite pets to answer the questions. Students then write a number sentence to show greater than and less than values.
Curated OER
Solution Sets
In this solution set worksheet, 9th graders solve 5 different problems that include graphing on the x- and y-axis. First, they solve each inequality as needed. Then, students graph the solution set found in each on the coordinate plane...
Curated OER
Apple Graph
In this apple graph worksheet, students survey their classmates to see what type of apple they enjoy eating the most. Students graph their data.
Other popular searches
- Graphing Linear Inequalities
- Graphing Inequalities
- Math Graphing Inequalities
- Graphing Compound Inequalities
- Algebra Graphing Inequalities


