Inside Mathematics
Snakes
Get a line on the snakes. The assessment task requires the class to determine the species of unknown snakes based upon collected data. Individuals analyze two scatter plots and determine the most likely species for five additional data...
Inside Mathematics
Population
Population density, it is not all that it is plotted to be. Pupils analyze a scatter plot of population versus area for some of the states in the US. The class members respond to eight questions about the graph, specific points and...
EngageNY
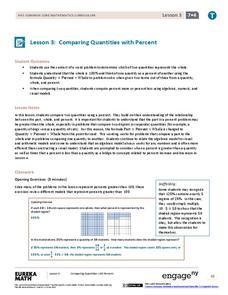
Comparing Quantities with Percent
Be 100 percent confident who has the most and by how much. Pupils use percentages to help make the comparisons by finding what percent one quantity is of the other. They also determine the percent differences between the two quantities.
Shodor Education Foundation
InteGreat
Hands-on investigation of Riemann sums becomes possible without intensive arithmetic gymnastics with this interactive lesson plan. Learners manipulate online graphing tools to develop and test theories about right, left, and midpoint...
Curated OER
Buying Cars/Financing Cars Compound Interest
Provide a real world context in which exponential functions are used to determine a eal world phenomena such as compound interest and exponential growth. This lesson should be taught after students have mastered the laws of exponents and...
Alabama Learning Exchange
Imaginary Numbers? What Do You Mean Imaginary?
Don't worry, this resource actually exists. Scholars learn about imaginary numbers and work on problems simplifying square roots of negative numbers. As an extension, they research the history of imaginary numbers.
Inside Mathematics
Squares and Circles
It's all about lines when going around. Pupils graph the relationship between the length of a side of a square and its perimeter. Class members explain the origin in context of the side length and perimeter. They compare the graph to the...
Curated OER
Dental Impressions
What an impressive task it is to make dental impressions! Pupils learn how dentists use proportional reasoning, unit conversions, and systems of equations to estimate the materials needed to make stone models of dental impressions....
Noyce Foundation
Parallelogram
Parallelograms are pairs of triangles all the way around. Pupils measure to determine the area and perimeter of a parallelogram. They then find the area of the tirangles formed by drawing a diagonal of the parallelogram and compare their...
Virginia Department of Education
Road Trip
Help plan a road trip with linear equations. Scholars consider two different rental car companies and write equations representing the cost for each company. They graph the system of equations to determine the conditions under which each...
Curated OER
Pythagorean Theorem by Graphic Manipulation
There are many different ways to show a proof of the Pythagorean Theorem. Here is a nice hands-on paper cutting activity that shows a graphic representation. You can even challenge your young Pythagoreans to come up with their own...
Wisconsin Online Resource Center
Oversized Inch
Each member of the class creates their own paper ruler. Using their ruler, kids walk around the room measuring the objects you've specified. Discuss how items should be measured to the 16th of an inch, the smallest unit on their ruler....
Noyce Foundation
Granny’s Balloon Trip
Take flight with a fun activity focused on graphing data on a coordinate plane. As learners study the data for Granny's hot-air balloon trip, including the time of day and the distance of the balloon from the ground, they practice...
Cornell University
Thin Films
Combine mathematics and science to calculate measurements of unmeasurable materials. Individuals use knowledge of density and volume to determine the thickness of the film used in production. They also apply stoichiometry to determine...
Curated OER
Stock Market Math
High schoolers calculate commission for a stock transaction through a broker using the relationship between percentages and decimals. They decide which stocks are preferable based on the price to earnings ratios listed on the stock...
Curated OER
1-4 Study Guide Integration: Statistics Stem-and-Leaf Plots
In this statistical worksheet, students organize given data into a stem-and-leaf plot. They then use their organize data to answer given questions. Students create two stem-and-leaf plots and answer five questions. An answer sheet is...
Curated OER
Growth and Decay
In this math worksheet, students compute the annual rate of appreciation or depreciation in a set of 7 problems. Each problem involves a given amount of money (or value) and indicates the percent of appreciation or depreciation.
Virginia Department of Education
Factoring for Zeros
Relate factors to zeros and x-intercepts. Scholars first graph quadratics in both standard and factored forms to see that they are the same. They go on to use the graphs to see the relationship between factors and x-intercepts.
Curated OER
Simplifying Expressions (1 of 2)
In this simplifying expressions worksheet, pupils combine like terms and complete 18 different problems.
Curated OER
How Alike Are We?
Fourth graders find the range, mode, median, and mean for each of the data sets (height and shoe size). They discuss which measure of central tendency for each data set best represents the class and why. Students graph the shoe size and...
National Security Agency
Sampling for a Rock Concert
Over the course of three class periods, middle schoolers design an experiment to provide learner input to administration about which rock band to invite to play at school. They practice several random sampling exercises, all well...
Curated OER
Subtracting from Ten: Using Math with Music
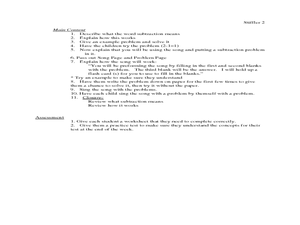
Students explore basic math functions by singing with their classmates. In this addition and subtraction lesson, students sing the song "5 Green and Speckled Frogs"and complete a list of subtraction problems. Students complete a...
Curated OER
Math Journal: Functions and Coordinate Geometry
Fifth graders examine the many uses of coordinate grids. In this graphing lesson, 5th graders write data driven equations, discuss the x and y-axis, and determine if using 2 or 3 ordered pairs is better. Students complete several...
Curated OER
Types And Magnitudes Of Earthquakes
Students investigate the concept of earthquakes and the different types of magnitudes. They research the Richter scale and how it is used to measure the intensities of earthquakes. Students then apply the concept by completing a...


