Curated OER
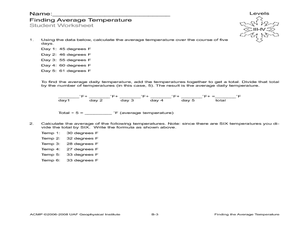
Finding the Average Temperature
Students calculate averages. In this average temperature instructional activity, students collect data and use their problem solving skills to calculate average temperatures.
Curated OER
Immigration: Marijana's Story
Second graders explore world geography by researching U.S. history. In this immigration lesson, 2nd graders read the book Marijana's Story and discuss the main character, her goals, and the plot. Students complete a worksheet about U.S....
Curated OER
The Human Face of Flagstaff
Students make a brochure for Flagstaff, Arizona. In this geography lesson, students look at a map of Arizona and the Flagstaff Chamber of Commerce sheet to find natural and human features of the city. They create a brochure describing...
Curated OER
This Place is Just Like the Other
Students write paragraphs that compare and contrast the geographical characteristics of Arizona and the Southwest region. In this geographical characteristics lesson plan, students complete a diagram and discuss how Arizona differs from...
Curated OER
Probability: Playing With Fire
Students problem solve to find the probability of each tree in a small forest to catch fire. In this probability lesson plan, students use the computer to complete this application.
Curated OER
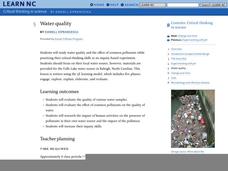
Water Quality
Students analyze water quality and turbidity of collected samples. In this physics lesson plan, students conduct tests to identify the suspended particles in the samples. They explain how human activities affect water quality.
Curated OER
The Story of How Deerfield Came to Be
Eleventh graders explore how the native peoples had lived in the Connecticut Valley for nearly 10,000 years, prior to the English settlement and how their culture and life ways were markedly different from that of the English settlers.
Curated OER
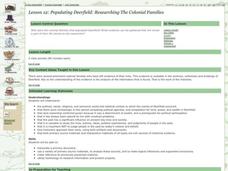
Populating Deerfield: A Workday for Researching the Colonial families
Eleventh graders explore who were the colonial families that populated Deerfield and what evidence can be gathered that reveals a part of their life stories to the researcher.
Curated OER
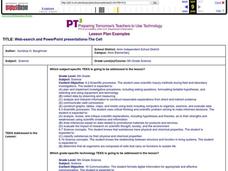
Web-search And PowerPoint Presentations-The Cell
Sixth graders create a PowerPoint presentation using information that they have compiled from their web search and rubric web sites, text and other applicable references. They work in pairs to complete these searches and projects.
Curated OER
Cause and Effect
Third graders identify the causes and effects of the story, "If You Give A Pig a Pancake" and "If You Give a Mouse a Cookie", by Laura Numeroff. They write a cause and effect story using Kidspiration.
Curated OER
Sampling Snoops
Students practice formulating a hypothesis and designing an experiment to test the hypothesis. They identify several sampling techniques they can use to test their hypotheses.
Curated OER
Epidemiology: Graphing and Analyzing Health Data
Students graph data on fetal and infant mortality rates collected by the Centers for Disease Control and Prevention. They identify trends in the data and propose potential causes for the trends.
Curated OER
Lab Report Template
Students write a paragraph (complete sentences) which explains what they did in the lab.
Curated OER
RADIATION PROTECTION: HOW MUCH IS ENOUGH?
Young scholars study the effects of shielding on the amount of detectable radioactivity from a gamma source. They investigate the shielding of one type of metal, then design their own experiments to answer questions raised during the...
Curated OER
Up, Up, and Away
Fifth graders participate in a WebQuest that introduces them to a study on clouds and how they relate to weather systems.
Curated OER
Beyond the Story: A Dickens of a Party
Seventh graders collaboratively research the life and times of Charles Dickens as it relates to a character from the story, and write and present a first-person character analysis.
Curated OER
Up, Up and Away with the Scientific Method
Students utilize the scientific method to design a way for a balloon to be suspended between the floor and the ceiling.
Curated OER
Dealing With Data
Students collect, organize, and display data using a bar graph, line graph, pie graph, or picture graph. They write a summary describing the data represented and compare the graph to another graph in the class.
Curated OER
Saving Money Through Mathematics
Third graders discuss light sources and collect data about energy sources. They compare data and create a multiple line graph showing energy used by light sources for each student in the group. They present their graphs and write a...
Curated OER
Map the Mystery!
Seventh graders read the novel, "The House of Dies Drear", and create a story map to analyze the plot and recall events.
Curated OER
Could You Repeat That?
Students participate in an oral story telling activity designed to show how story embellishments occur. They read "Beowulf" and identify incongruities that suggest additions and embellishments over the years.
Curated OER
Underground Railroad
Fourth graders use internet cites to explore the Underground Railroad. They also learn the importance of the Emancipation Proclamation. Focus questions are included.
Curated OER
Learning From Leaves: Adaptations To Differing Light Levels
Students, in groups, examine plants with different light levels. They are given plants from a tropical and desert region. They write a hypothesis at the beginning of the experiment.
Curated OER
Forest Activity: Forest Layers
Learners examine the forest layers and types of forests. They explore a website, read content on forest layers and the effects of environmental conditions, sumarize the characteristics of a forest type and present the information to the...


