Curated OER
Wavelengths of Light
Explore physical science by participating in a visual spectrum experiments. Budding scientists identify the colors in the color spectrum and view the colors in class by utilizing cellophane, flash lights, and other arts and crafts...
Kenan Fellows
Determining Stream Health by the Diversity and Types of Benthic Organisms
How diverse are the benthic organisms found in local streams? Using the information learned in previous lessons on identification of macroinvertebrates and on calculating stream index values, groups determine the health of local...
Curated OER
Esperanza Rising - Literature Circles and Review (Day 3)
Kids love working with their peers. Get your class into small literature circles and have them complete weekly assignments. Before beginning this week's activity, have each learner write a letter from Esperanza in California to Abuelita...
Science 4 Inquiry
Layers and Laws: The Law of Superposition and Index Fossils
What can layers of rock teach us about the climate? Young scientists solve a mystery about who stole a cookie by applying the law of superposition. Then, they apply the same concept to solve a more difficult mystery, trying to determine...
Science 4 Inquiry
Temperature of Inner Planets
Mars, Earth, and Venus contain atmospheres that generate weather. Young scientists explore the temperature of inner planets. They create a model simulating the greenhouse effect before researching and answering guided questions to...
Curated OER
Monster Data
An inventive lesson shows learners how to collect, organize, and present mathematical data. They access websites which lead them through a variety of ways to engage in data collection. They get to design and create graphs, and present...
Virginia Department of Education
Graphs
Examine different types of graphs as a means for analyzing data. Math scholars identify the type of graph from a series of data displays and then develop questions to match each one. Then, given a scatter plot of height versus age...
Curated OER
M & M Madness
Students work with the mathematics unit of collection, organization, and presentation of data. In this math and technology lesson plan, students use Valentine M & M’s and The Graph Club to sort and graph the various colored M & M’s.
Curated OER
A Geological Puzzle
Students compare and contrast the various types of rocks on each continent. In groups, the calculate the rock ages and types to determine if the continents, in their opinion, were joined at one time. They develop two imaginary...
Curated OER
The Newspaper Article
Have your class participate in an interview activity using an informational text about the Amazon. After reading a Cultural Connections story about a person from the Amazon, middle schoolers write interview questions based on the text....
Virginia Department of Education
Weather Patterns and Seasonal Changes
Get your class outside to observe their surroundings with a lesson highlighting weather patterns and seasonal changes. First, learners take a weather walk to survey how the weather affects animals, people, plants, and trees during...
Curated OER
Sea Ice: Unscrambling the Egg Code
Students determine sea ice thickness, concentration, and floe size by reading egg codes. In this sea ice conditions lesson, students color code a map based on prescribed criteria and use the maps to identify changes in sea ice...
Curated OER
Keep it Active
Young scholars explore the active layer above permafrost and investigate various factors on the insulation value of the active layer. In this energy transfer lesson, students conduct and experiment to determine the effects of snow...
Curated OER
Traveling Through the Solar System
Students use calculator and non-calculator methods for analyzing data. They apply data collection and analysis in a study of mass and weight. Students enhance and apply the concept of line of best fit. They master graphing in a plane,...
Curated OER
Inspector Readers: The 002 Book Club
This unit introduces book clubs/literature circles to lower elementary classes, but could be adapted to higher grades. It outlines the anticipatory activity that includes a WebQuest, a discussion to clarify questions about the unit,...
Curated OER
Questioning NASA
Space science and math collide in this inquiry that investigates launching times for antacid-tablet rockets! Upper elementary or middle school learners collect data as they launch these mini rockets. They apply concepts of place value...
Google
Surveys and Estimating Large Quantities
Looking for an estimation activity a bit more involved than the typical "guess the number of jellybeans in the jar" game? Here, learners use a picture to estimate the number of people at a large event, look for potential problems with...
Curated OER
Illuminating Climate Change: Connecting Lighting and Global Warming
Students analyze energy usage and connect energy usage to fossil fuel consumption. In this global warming and pollution lesson, students what fuels are used to generate electricity and how much CO2 each fuel produces, then graph the...
Curated OER
Relative Ratios
Learners discover that proportions are made up of equal ratios each containing the same building blocks. They, using the Internet, apply their knowledge of direct relationships and proportions to problems in planetary science.
Curated OER
The Colors of Chemistry
Students investigate the acidity and alkalinity of common household products in an experiment. They use red cabbage juice and litmus paper to show the difference between strong acids and bases as they work with vinegar, dish washing...
Curated OER
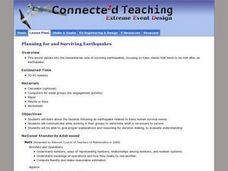
Planning for and Surviving Earthquakes
Students work in small groups to explore the FEMA for Kids site. They take the role of FEMA officials. Student list three items they may need to survive an earthquake. They complete a worksheet and discuss their results with the rest of...
Curated OER
The Recess Queen
Students read, The Recess Queen and answer questions about the book. In this story book lesson, students write stories about situations that they have gone through similar to what was in the story.
Curated OER
Data, Data, Everywhere... and What Am I To Think?
Learners demonstrate good random sampling techniques for data collection, select and develop graphic presentations of data and analyze the data to solve a problem presented.
Curated OER
Anything I Can Do You Can Do Better
Students complete a two-week unit involving design and construction concepts. They watch a PowerPoint presentation about geometric shapes, draw the fourteen shapes incorporated in bridge construction, and in small groups design, build,...


