Curated OER
Activity 4: Alvin Dive, A Mysterious Encounter and Change Over Time
Students receive copies of the Time Series Observations to use for note-taking. They work in small groups to discuss what they see when the outside lights of Alvin are turned on, and off, where the bacteria may have come from. They view...
Curated OER
Analog Forecasting
Students recognize the elements of an analog weather forecast. For this weather forecasting lesson, students use a website and look for trends, persistence and climatology in weather forecasting. Students complete a...
Curated OER
Excel temperature Graphs
Learners gather data about the weather in Nome, Alaska. In this Nome Temperature lesson plan, students create an excel graph to explore the weather trends in Nome. Learners will find the average weather and add a trend line to...
Curated OER
SUNSPOTS SPOTTED
Students study sunspots and their motion, from data gathered, they determine the significance of the sunspot data. The data be used to calculate the rotational period of the sun. They draw conclusions as to the sunspot's impact on the...
Curated OER
Louisiana Regional Foodways
Students strengthen their research techniques in locating, selecting, and synthesizing information from a variety of texts, media, references and internet resources to study regional food way traditions in Louisiana. They assess the...
Curated OER
Timeline of Extreme Weather Events
Students research and chart extreme weather events on a timeline. In this extreme weather lesson, students interview older people who have experienced extreme weather events. Students complete a worksheet based on the information of the...
Curated OER
Local Hydrologic Cycle
Students draw the water cycle as it occurs in their community. In this water cycle lesson, students observe demonstrations of sublimation and infiltration. They also use photographs or their own drawings of their...
Curated OER
Build a Weather Vane
Third graders measure wind direction. In this weather lesson plan, 3rd graders build a weather vane from a straw, skewer, spool, and flag. Students measure wind direction using their weather vane.
Curated OER
Sea Ice Board Game
Learners understand the sea ice cycle and can explain its stages. In this Sea Ice lesson, students play a game to identify types of sea ice. Learners answer critical thinking questions about sea ice. Students complete a sea ice worksheet.
Curated OER
Hurricanes and Tornadoes (Grade 4-8)
Young scholars investigate the concepts of hurricanes and violent weather conditions. In this violent weather instructional activity, students access an Internet site and watch a video about how air masses behave, how a tornado forms,...
Curated OER
Biological Relationships - Coral Reef Memory Game and Chain Game
Students familiarize themselves with the interconnectedness of species within an ecosystem, and to use this knowledge to evaluate how the removal or decimation of one species can have far reaching effects.
Curated OER
Kentucky: Past, Present and Future
Fourth graders analyze how Kentucky's past is different from the present. They research why Kentucky was even explored and settles. What social issues face Kentucky now. Discussion lies on how Kentucky can be improved for the 21st century.
Curated OER
Zoom Out
Learners explore visual perception and how objects change as distance changes. In this distance and vision lesson, students practice their scientific inquiry skills. Learners practice drawing objects from different points of view in...
Curated OER
Clouds
Students recognize the three main types of clouds. In this clouds lesson, students create a cloud mobile to understand clouds.
Curated OER
The Great Heat Escape
Learners observe a demonstration on the role of thermal conductivity in heat transfer. In this thermal conductivity lesson, students design and conduct an experiment to compare the thermal conductivity of four substances....
Curated OER
Measuring Humidity
Students measure humidity in the classroom. In this weather lesson, students use a psychrometer to measure the humidity in the classroom. Students complete a lab packet.
Curated OER
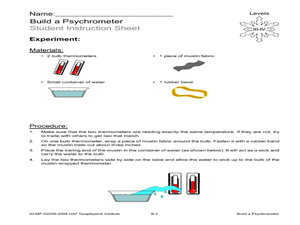
Build a Psychrometer
Students understand that a psychrometer is a weather instrument used to detect humidity. In this psychrometer instructional activity, students build a psychrometer. Students use their psychrometers to measure humidity activity.
Curated OER
Our Sun and the Four Seasons
Students discover the relationship between the sun and Earth. In this weather lesson, students examine the effect of the sun on the Earth's seasons. Students complete a weather activity using props to simulate the sun and...
Curated OER
Temperature
Students understand that temperatures in Alaska can be negative numbers. In this temperature lesson, students recognize the temperatures above and below zero. Students compare temperatures using the greater than and less than signs....
Curated OER
How Oceans Affect Climate
Students draw conclusions about how the ocean affects temperature. In this weather lesson, students use the Internet to gather data to help them come to a conclusion about how the climate in a certain region is directly affected by the...
Curated OER
Hydrologic Cycle Scavenger Hunt
Students explore the water cycle using educational resources. In this water cycle lesson, students use a global climate DVD to complete a scavenger hunt on the hydrologic (water) cycle.
Curated OER
Water Cycle Bag
Students enclose water in an airtight bag and leave it in a warm area to view the water cycle. In this water cycle lesson plan, students observe evaporation, condensation, and precipitation. They then discuss what they learned about the...
Curated OER
Convection and Wind
Students use water, beakers, hot plates, paper dots, and goggles to participate in a hands on activity where they see how a convection current creates wind. In this convection current lesson plan, students participate in a hands on...
Curated OER
Climate Change
Students compare weather data and draw conclusions. For this climate change lesson plan, students determine whether data collected over a period of ninety years shows a warming trend.


