Curated OER
Biggest Trees in the United States
Learners use the Internet (or printed sources) to locate information. They fill in missing information on a graphic organizer (chart) and use the data to answer questions. The research skills help students to develop higher order...
Curated OER
Operations with Signed Numbers
Students complete a variety of activities to comprehend concepts of operations with signed numbers. The integration of technology make the delivery of the instructional activity much more exciting for Students.
Curated OER
Net "Working"
Upper elementary and middle schoolers explore the properties of various polygons. They use video, resource links, and engage in hands-on activities in order to construct geometric nets. This fine plan should lead to increased...
Curated OER
Splitting the Penstock
Students investigate the best way to calculate the measurements of an area. In this geometry activity, students relate a large circle to a cylinder and its measurements. They use PVC pipes to gain hands on experience as they calculate...
Curated OER
Exploring Dietary Guidelines and Healthy Eating Patterns
How nutritious is a tiny lollipop? Pass them out to your class as they view a PowerPoint presentation on the basics of nutrition. The students measure and record their weight and height and then carry out a computer activity using their...
Curated OER
Mean and Standard Deviation
Get two activities with one lesson. The first lesson, is appropriate for grades 6-12 and takes about 20 minutes. It introduces the concept of measures of central tendency, primarily the mean, and discusses its uses as well as its...
Curated OER
Properties of Matter
Ninth graders explore the molecular structure of matter and how it can affect the physical characteristics of a specific material. They demonstrate that isotopes of an element have different masses. Students demonstrate that the rates of...
Curated OER
Let's Meet The Presidents
Create a digital movie documenting research about an American President. Using internet sources, students with special needs gather information about their chosen president. Working in groups, they use this information to create a...
Illustrative Mathematics
Data Transfer
A question to ask your class is, How fast is your Internet? That depends on the data transfer rate (DTR), which is the unit rate used in this activity. Math students will calculate how long it takes to download a music file and a video...
Curated OER
Layers of the Atmosphere Foldable
Aspiring meteorologists make themselves a tool for reviewing the characteristics of each layer of the atmosphere. The procedure for this little project divides the paper into five sections, but many earth science teachers opt for the...
Curated OER
A Salute to Flag Day
Use Flag Day as a learning opportunity for your classroom. Collect a variety of books and other resources on the subject of the U.S. flag. Have pupils conduct independent research at home and come to class prepared to share some fun...
Curated OER
The Japanese Garden
Students use the internet to gather information on the Japanese Gardens. They discuss topics with a horticulturist and build a replica of the gardens at their school. They work together to identify different types of plants.
Curated OER
Online Math Facts Games
Pupils use online games to reinforce math-facts knowledge, engage in a game the way they might be engaged in an arcade game, and try to be one of the class's top-scorers each week. A good filler or extension activity.
Learn NC
Peanut Butter and Jelly and Order of Operations
Study order of operations using a peanut butter and jelly sandwich activity as your guide. The class watches you make a peanut butter and jelly sandwich based on a volunteer's instructions. They discuss the importance of following...
Curated OER
3-D Figures Part 1
Elementary schoolers explore 3-D shapes. They transition from thinking of shapes as only 2-D. Pupils read Cinderella as a launching activity for their upcoming adventure, and explore a new world of 3-D shapes in this introductory...
Curated OER
Trips of Culture: The Statue of Liberty
Students take a pre-trip quiz about the Statue of Liberty and take a photo tour on the Internet. They then produce a grid drawing of an object and use a known measurement to estimate unknown measurements.
Curated OER
Significant What?
Students define accuracy and precision, and differentiate between the two terms, apply the concepts of accuracy and precision to a given situation and correctly apply the concept of significant figures to measurement and mathematical...
Curated OER
Linking Kwanzaa to Technology and History
Seventh graders use the Internet to research the holiday of Kwanzaa. Using the information, they create a brochure to promote the holiday to others. They email the information to a friend to end the lesson.
Curated OER
Safe Driving Solutions
Students act as commissioners researching needed safety standards for vehicles and highways. They then draft recommendations to be included in a new highway safety bill. They cite reasons a particular measure would reduce fatal highway...
Curated OER
Cruising the Internet
Students identify the parts of an engine using a graph. In this statistics lesson, students make a graph from their collected data. They calculate the volume of a cylinder using a line of regression and a scatter plot.
Curated OER
Graphing Activity
In this probability and statistics worksheet, learners work with a family member to construct graphs based on real life data. The two page worksheet contains three questions. Answers are not included.
Curated OER
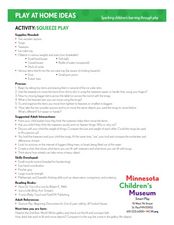
Squeeze Play
Young scientists demonstrate how to move objects. In this fine motor lesson, students use various objects such as dice, erasers, and soft balls and move them using the proper device.
Curated OER
What is the Average Height of Your Class?
In this statistics lesson plan, learners use an on-line form generator create a class-specific form, then complete the form, view a graph and data analysis, and draw conclusions.
Curated OER
What's Your Average? What Do You Mean? I'm More Than Just Average
Upper grade and middle schoolers collect data, analyze and interpret the data. This three-part lesson should provide learners with a firm understanding about the differences between mean, median, and mode and how to perform the...


