Newspaper Association of America
Critical Thinking through Core Curriculum: Using Print and Digital Newspapers
What is and what will be the role of newspapers in the future? Keeping this essential question in mind, class members use print, electronic, and/or web editions of newspapers, to investigate topics that include financial literary,...
Curated OER
Bar Graphs and Survey Questions- Internet Access
In this graphing and data collection activity, young scholars examine a bar chart that show data collected from 1998 - 2006 that shows the percentage of households that have Internet access. They answer questions based on the chart and...
Curated OER
Use Google Maps to Teach Math
Capture the engagement of young mathematicians with this upper-elementary math lesson on measuring time and distance. Using Google Maps, young scholars first measure and compare the distance and time it takes to travel between different...
Curated OER
Ornithology and Real World Science
Double click that mouse because you just found an amazing lesson! This cross-curricular Ornithology lesson incorporates literature, writing, reading informational text, data collection, scientific inquiry, Internet research, art, and...
Curated OER
Traveler: Webelos Activity Workbook
This three-page worksheet is designed to be used by the Weblos of Boy Scouts of America. They are given 13 choices of academic activities that involve the use of maps, geography, math, and money. They must complete five of the activities...
Curated OER
Start Your Engines: An Internet Research Lesson
Fifth graders engage in a lesson which offers informational how-tos for conducting research on the Internet. Three search engines are introduced and used to gather information to solve a specific problem.
Curated OER
Searching the Internet for Information
In this searching the Internet worksheet, students solve and complete 20 various short answer questions related to the Internet. First, they find information on the Internet and communicate that information to others via email. Then,...
Curated OER
The 3R's: Rights, Rules, and Responsibilities
Eighth graders complete seven work stations that highlight math activities while they focus on the rules for Internet use and classroom rules for working in cooperative groups. After completing the activities, they complete a self-...
Curated OER
Internet Measurement
Students become familiar with how to get information from the Internet. In this math and technology lesson plan, students measure objects on a measurement sheet found on a web site. They practice using a standard unit of measurement...
Curated OER
Proportionality Using Labyrinths and Mazes
Conduct research on the Internet about labyrinths and mazes to learn about proportions and ratios. Inquisitive minds design their own maze, one maze is chosen and proportionately enlarged to 20 feet by 30 feet. This is a fun challenge...
US Department of Commerce
Looking at Numbers of Births Using a Line Graph
Was there a baby boom? Using census data, class members take a look at the number of 8-11 year olds and determine their birth years. Scholars create a double line graph to compare the number of births for two states for several years....
Alabama Learning Exchange
Triangle Area: No Height? Use the Sine
No height? No problem! Learners use their knowledge and a little help from GeoGebra to develop the Law of Sines formula. The Law of Sines helps to determine the height of triangles to calculate the area.
Curated OER
Math Internet Scavenger Hunt
Students utilize online research skills to surf the Internet and complete an online scavenger hunt to find the answers to various mathematical questions.
Curated OER
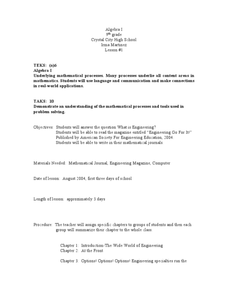
Problem Solving Using Math
Students solve real life scenarios using algebra. In this word problem lesson, students use different websites dealing with engineering as it relates to the real world and math. They use other resources such as magazines to solve word...
Curated OER
Baseball Stats
Students explore data sheets and statistics in baseball. They use baseball data available on the Internet to develop an understanding of the different ways in which data can be analyzed.
Curated OER
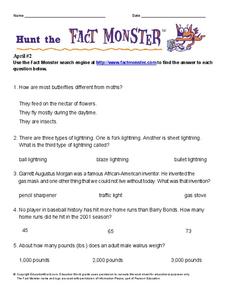
Hunt the Fact Monster
In this Fact Finder worksheet, students access the Internet to a specific site to find the answers to five questions with multiple choice answers.
Curated OER
Hunt the Fact Monster
In this Fact Monster search engine worksheet, students access the Internet to a specific website to find the answers to five questions with multiple choice answers.
Curated OER
Hunt the Fact Monster (November #2)
In this Fact Monster search engine worksheet, students access the Internet to a specific website to find the answers to five questions with multiple choice answers.
Curated OER
Sunrise, Sunset
What locations on Earth get the longest number of hours of daylight in the summer? Hint: It's not the equator! Use real-world sunrise and sunset data to develop trigonometric models that can be used to estimate the number of hours of...
Virginia Department of Education
Logarithmic Modeling
Explore logarithms and logarithmic regression. Young mathematicians first learn about inverse functions and about the logarithm function family. They take their newfound knowledge to use logarithmic functions to model situations and...
Virginia Department of Education
Exponential Modeling
Investigate exponential growth and decay. A set of six activities has pupils collecting and researching data in a variety of situations involving exponential relationships. They model these situations with exponential functions and solve...
August House
Go to Sleep, Gecko
Use this multidisciplinary lesson to delve into these subjects: English language arts, math, science, drama, and character education. After reading, discussing, and making interpretations about Go To Sleep, Gecko!: A Balinese Folktale by...
Shodor Education Foundation
Function Flyer
Fly through graphing functions with the Function Flyer. Young mathematicians use an interactive to graph different types of functions. A set of exploration questions has users investigate patterns in functions.
Shodor Education Foundation
Plop It!
Build upon and stack up data to get the complete picture. Using the applet, pupils build bar graphs. As the bar graph builds, the interactive graphically displays the mean, median, and mode. Learners finish by exploring the changes in...
Other popular searches
- School Internet Use
- Internet Use in Biology
- Ethical Internet Use
- Lessons on Internet Use
- Plant Parts Internet Use
- How to Use the Internet
- Use an Internet Program Gizmo
- Technology Internet Use
- Ethical Use of Internet
- Use the Internet
- How to Use Internet
- Use an Internet Program


