Curated OER
Travel Mug Design
Students create and develop a travel mug. They create visuals and a three dimensional infomercial. They apply an engineering design and demonstrate knowledge of thermodynamics involved in heat transfer. They illustrate Newton's Law of...
Curated OER
Environmental Mathematics
Eighth graders determine food that they would need to survive in the wild. They graph the best foods for their environments and rate the survivability rate for each member of their group.
Curated OER
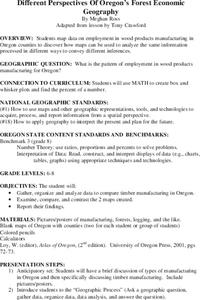
Different Perspectives of Oregon's Forest Economic Geography
Students locate the many forests located in Oregon. In groups, they use the internet to research employment data on wood products made in the state. They discuss how looking at information presented in a different way can change their...
Texas Instruments
Texas Instruments: Box Plots: How Many Pairs of Socks
The purpose of this lesson is to help students use the shape of a line plot to interpret the shape of a box plot.
Texas Instruments
Texas Instruments: Get on the Stick
In this activity, students use a CBR 2 to measure the reaction time of catching a stick. They also learn how to interpret a box plot, and make a five number summary of a single variable data set.
Khan Academy
Khan Academy: Comparing Data Displays
Practice interpreting and comparing dot plots, histograms, and box plots. Students receive immediate feedback and have the opportunity to try questions repeatedly, watch a video or receive hints.
Annenberg Foundation
Annenberg Learner: Learning Math: Min, Max and the Five Number Summary
Explore how to interpret a large set of data by dividing it up into smaller portions in order to answer statistical questions.
CK-12 Foundation
Ck 12: Statistics: Box and Whisker Plots Grades 9 10
[Free Registration/Login may be required to access all resource tools.] Make and interpret a box-and-whisker plot for a set of data.
Khan Academy
Khan Academy: Interpreting Quartiles
Practice understanding the meaning of quartiles of data sets. Students receive immediate feedback and have the opportunity to try questions repeatedly, watch a video or receive hints.
Texas Education Agency
Texas Gateway: Tea Statistics: Descriptive Statistics: Introduction
In these exercises to introduce descriptive statistics, students will construct a histogram and a box plot, calculate univariate statistics, and interpret the data in the graphs.
Oswego City School District
Regents Exam Prep Center: Practice With Organizing and Interpreting Data
Several problems are presented to test your skills in creating and interpreting frequency tables, pie charts, box-and-whisker and stem-and-leaf plots.


