Curated OER
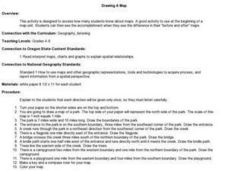
Drawing A Map
Students discuss any information they already know about maps. As a class, they draw a map of a park following written directions making sure to include a compass rose and key. They are graded based on a rubric and discuss the need for...
Curated OER
Wetlands: Pave or Save?
Students discuss the characteristics of wetlands and how to make them more productive. Using a map, they locate the major wetlands in the United States and color them using a key. They read an article and in groups answer discussion...
Curated OER
Volcanoes, Earthquakes, and Tsunamis
Middle schoolers work in groups to research a tsunami, earthquake, or volcano. They use the internet to find information, and create a presentation. Each presentation should include a definition of their phenomenon, an illustration,...
Curated OER
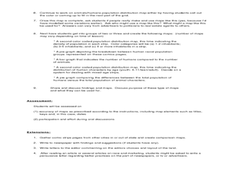
What is the Population Distribution of Cartoon Characters Living On the Pages of Your Newspaper?
Learners read various cartoons in their local newspaper and calculate the population demographics, spatial distribution and grouping of the characters. Using this information, they create a population distribution map and share them with...
Curated OER
Paws in Jobland: Lesson Plan 35 - Catch of the Day
Students study information for fish farm workers given in the form of a chart, in order to practice interpreting data while learning about the career of a fisherman. In this data interpretation lesson, students read the chart to find out...
Curated OER
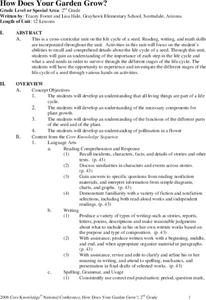
How Does Your Garden Grow?
Students complete activities to learn about the life cycle of a seed. In this plant growth lesson, students complete activities for the life cycles of seeds.
Curated OER
Measuring to the Nearest Inch
Third graders use whole numbers and fractions to make connections between abstractions of the mathematical world and the real world. For this fractions and measurement lesson, 3rd graders identify, quantify groups , and measure...
Curated OER
Seasons and Cloud Cover, Are They Related?
Students use NASA satellite data to see cloud cover over Africa. In this seasons instructional activity students access data and import it into Excel.
Curated OER
Synthesis of Information
Locating and synthesizing information is an essential part of the research process but can be overwhelming for many young writers. Eliminate some of the stress and confusion, this resource suggests, by separating these steps. To focus...
Curated OER
Heartbeat Project
Students enter information about their heartbeats into a spreadsheet. They construct data displays and calculate statistics. They describe and justify their conclusions from the data collected.
Curated OER
Interviews with the American People "Days of Infamy"
Students compare and contrast statements made by people in "Man on the Streets." They are interviewing them on the current war in Iraq and how they felt on Sept. 11th. These interviews are tape recorded. To see what kinds of questions to...
Curated OER
Building Understanding of Rate of Change/Slopes Using Alice
Students explore slope as a rate of change. In this eighth grade mathematics lesson, students investigate real-world problems to determine rate of change and transform it into a linear representation, thus determining slope. Students...
Curated OER
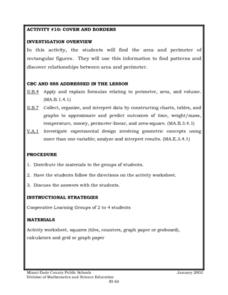
Cover and Boarders
Students find the area and perimeter of rectangular figures. They use this information to find patterns and discover relationships between area and perimeter. Students apply and explain formulas relating to perimeter, area, and volume.
Curated OER
Schoolyard Bird Project
Middle schoolers observe and count bird sightings around their schoolyard throughout the school year.
Curated OER
Mapping Perceptions of China
Students discuss what types of things are included on a map. They compare and contrast maps of China with a map they create and practice using different types of maps. They write analysis of their classmates maps.
Curated OER
What is the Rock Cycle and Its Processes?
Geology beginners examine three different rock samples and determine their origin by their characteristics. By making and recording observations, they become familiar with features of igneous, metamorphic, and sedimentary rock types....
Curated OER
Design Your Own Building
Students explore the use of design principles in the real world. They evaluate how problems can be solved using design principles. In groups, students design the floor plan for a building of their choice.
Curated OER
Treasure Hunters
Students design an on campus treasure hunt to find various architectural vocabulary words which they then create definitions for on the blog page on the Environmental Design website.
Curated OER
Shadow Casting
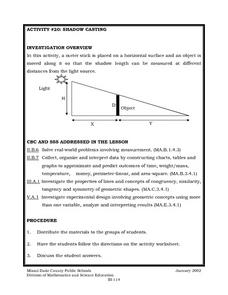
Eighth graders use a meter stick that is placed on a horizontal surface and an object is moved along it so that the shadow length can be measured at different distances from the light source. They solve real-world problems involving...
Curated OER
Using the Landscape Picture Map to Develop Social Studies Skills
Enhance your class' geography skills using this resource. Explore a variety of concepts including production and distribution, and people and the environment. Learners make predictions and identify locations on maps. This is a creative...
Curated OER
Indian Women in Texas History
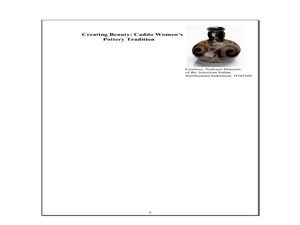
Fourth graders study Indian women in Texas. In this US history lesson, 4th graders discuss what each Indian woman's contribution was by completing a timeline and table. Students examine the Caddo Women's pottery tradition...
Texas State Historical Association
Tejanas and LULAC
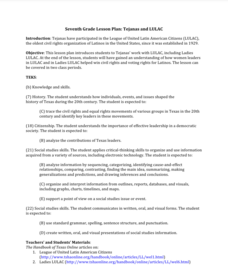
Seventh graders explore the Latino Civil Rights Movement. In this civil rights lesson plan, 7th graders discover the role of the League of United Latin Citizens (LULAC) as well as the women's arm of the organization and write essays that...
Curated OER
Documenting Texas Women’s History through Photographs
Students explore women’s history. In this women’s studies lesson plan, students will examine seven photographs that depict prominent female figures from Texas’s history. Students will engage in a discussion of the photographs as a mode...
Eastconn
Learning to Analyze Political Cartoons with Lincoln as a Case Study
Discover the five main elements political cartoonists use—symbolism, captioning and labels, analogy, irony, and exaggeration—to convey their point of view.


