Curated OER
Exploring Exponential Growth and Decay Functions
Learners differentiate between exponential growth and decay. In this algebra lesson, students solve exponential equations using properties of exponents. They use the Ti calculator to graph and analyze their functions.
Curated OER
East Asia & The World
Students discuss the relationships between East Asia and the United States. They examine the importance of trade and politics. They examine graphs and charts of certain aspects of the region and discuss.
Curated OER
Sea Changes: A New England Industry
Students conduct research in order to use primary and secondary sources. They interpret and analyze information from textbooks and nonfiction books for young adults, as well as reference materials, audio and media presentations, oral...
Tech Know Teaching
5th Grade Constructed Response Question
New to constructed response question worksheets? Here's a model that demonstrates how to construct questions that require readers to interpret graphics found in informational text.
Curated OER
Stock It To Me
Students investigate the stock market using stock market tables, charts, and graphs. They participate in a simulation of stock market investment over time. They read about the history of Wall Street and the Stock Market.
Curated OER
Keypals and You
Pupils collect and compare data received from keypals. They use electronic mail to exchange information with keypals and rrite a paper comparing similarities and differences between themselves and their keypals. In addition, use a...
Curated OER
Climographs
Learners identify trends and characteristics of climate zones and specific places within. Then, they graph annual climate trends (primarily Temperature and Precipitation) and create, interpret and extrapolate information based on...
Curated OER
Jelly Bean's Galore
Students investigate the origins of the Jelly Bean. They complete a Scavenger Hunt using the jellybean website. Pupils create a bar graph using information collected about jelly beans. Students discuss the time of year that Jelly Beans...
Curated OER
The Battle of Fort Moultrie
Eighth graders interpret historical evidence presented in primary and secondary resources. In this American Revolution lesson, 8th graders examine the Battle of Fort Moultrie and create their own historical narratives regarding the event.
Curated OER
T-Shirt Lettering
Students determine the cost of a t-shirt using a variety of mathematical operations to solve problems. Then they use a spreadsheet to calculate the cost of lettering a t-shirt and display this information in a graph.
Curated OER
Technology Blackout Day
Students describe the impact of modern technology inventions on daily life. They create a graph of the class's favorite item of technology and draw a picture of their favorite piece of modern technology.
Curated OER
The Perfect Principal
Learners demonstrate their understanding of math skills. In this data analysis lesson, students complete a worksheet requiring them to calculate mean, median, and mode, and create and interpret graphs. Lesson is intended as an assessment...
Curated OER
Building a Memorial to the Underground Railroad
Learners interpret historical evidence presented in primary and secondary resources. In this Underground Railroad activity, students examine the attributes and function of the Underground Railroad in order to...
Curated OER
Streamflow
Pupils discuss the topic of streamflow and how it occurs. They take measurements and analyze them. They interpret data and create their own charts and graphs.
Curated OER
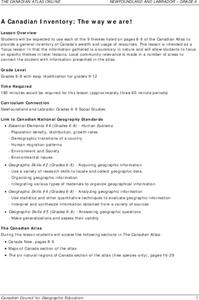
A Canadian Inventory: The Way We Are!
Students use the Canadian Atlas to discover an inventory of Canada's wealth and usage of resources. Using charts and graphs, they produce a wall of selected data of importance to the country and identify one issue of sustainability. ...
Curated OER
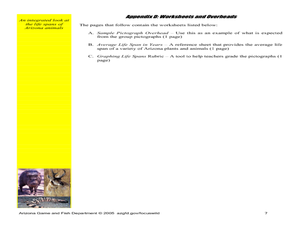
Charting Animal Life Spans
Second graders research animal life spans and complete related math activities. In this life span lesson, 2nd graders read How Many Candles and discuss life spans. Students arrange animal cards based on their life spans. Students find...
Curated OER
Interpreting a Flowchart
Learners examine insects place in a community. They discover the communities of insects.
Radford University
Sleep and Teen Obesity: Is there a Correlation?
Does the number of calories you eat affect the total time you sleep? Young mathematicians tackle this question by collecting their own data and making comparisons between others in the class through building scatter plots and regression...
Curated OER
Voter Turnout
Students solve problems using math. They complete a graph, using data from the 2000 presidential election results. Students predict and calculate the outcome of the election based upon the voting patterns.
Curated OER
Driving Forces Forestry In Canada
Students discuss the natural and economic impact of forests and forestry. Using given statistics they construct different types of graphs in which they make observations and draw conclusions.
Curated OER
Korea Cultural Lesson Plan
Students engage in a study of geography and maps of Korea. They examine charts and graphs. Students are expected to interpret the information accurately and completely. The geography skills can be used on other countries as well.
Curated OER
Count The Letters
Students perform activities involving ratios, proportions and percents. Given a newspaper article, groups of students count the number of letters in a given area. They use calculators and data collected to construct a pie chart and bar...
Curated OER
Algebra: Reaching New Heights
Students work in pairs to measure their arm span and height and record them on a class chart. The class works together to create a scattergram to display the data. Class discussion focuses on interpreting the scattergram.
Curated OER
Recording Frequency
First graders analyze nursery rhymes and gather data about word frequency. In this frequency lesson plan, 1st graders create graphs and tables. Students interpret the data.


