Curated OER
Burger King Investigation
Young scholars study data on the nutritional value of Burger King meals in order to discover its nutritional value and also to compare the meals, using mathematical computation, to the recommended daily diet. In this data handling...
Curated OER
Jelly Bean's Galore
Young scholars investigate the origins of the Jelly Bean. They complete a Scavenger Hunt using the jellybean website. Pupils create a bar graph using information collected about jelly beans. Students discuss the time of year that Jelly...
Curated OER
T-Shirt Lettering
Learners determine the cost of a t-shirt using a variety of mathematical operations to solve problems. Then they use a spreadsheet to calculate the cost of lettering a t-shirt and display this information in a graph.
Curated OER
Technology Blackout Day
Students describe the impact of modern technology inventions on daily life. They create a graph of the class's favorite item of technology and draw a picture of their favorite piece of modern technology.
Curated OER
Which Method Will You Choose? Finding Solutions to Systems of Equations.
Ninth graders investigate systems of linear equations. In this Algebra I lesson, 9th graders determine which method is the best for solving a systems: graphing, substitution, or elimination. Students choose a method and create a...
Curated OER
Global Statistics
Students determine statistics based on data. In this statistics lesson, students use data and record in charts. Students create graphs based on the statistics found.
Curated OER
Pumped Up Gas Prices
Learners calculate gas prices. In this transportation lesson, students tally the mileage and gas costs of their car for one months. They figure out how much was spent on gas and create a graph showing average gas prices over time.
Curated OER
The Muckrakers Interdisciplinary Unit
Eighth graders complete an Interdisciplinary Unit on the Muckrakers and the Progressive Movement. Students describe life in America and how Progressive Reformers changed it. identify specific problems and propose solutions. Students...
Curated OER
Understanding Reconstruction in South Carolina
Eighth graders interpret historical evidence presented in primary and secondary resources. In this Reconstruction lesson, 8th graders research the role of Reconstruction in South Carolina by simulating the environment of East Bay Street...
Curated OER
How the Environment Affects Our Health
Ninth graders explore how the environment affects health. In this infectious disease lesson, 9th graders investigate what environmental situations cause infections diseases. Students study the symptoms, treatments, prevention, and...
Curated OER
Building a Memorial to the Underground Railroad
Students interpret historical evidence presented in primary and secondary resources. In this Underground Railroad activity, students examine the attributes and function of the Underground Railroad in order to...
Curated OER
Harry Potter Research Project
Young scholars work together to complete a research project on Harry Potter. They write a research question and develop a survey to give to their classmates. Using the results, they create a graph and draw conclusions about the data...
Curated OER
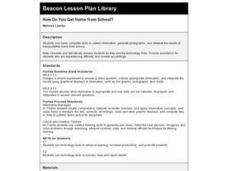
How Do You Get Home from School?
First graders create pictographs and interpret results of transportation home from school.
Curated OER
Exploring Wyoming Species Habitats
Students are introduced to the concept of species habitats and ranges. They introduced to ArcView GIS as a tool for mapping. Pupils use query data for species withina county, elevation, range, rivers and streams, land cover, and etc....
West Virginia Department of Education
The Debate - John Brown: Martyr or Madman?
Did he die for a cause, or was he crazy? Although the resource discusses John Brown and West Virginia history, many historical figures have the same reputation. Teach learners about different perspectives and highlight the importance of...
Achieve
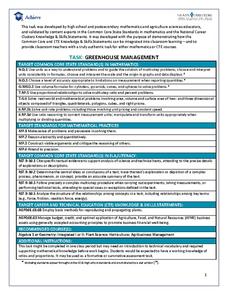
Greenhouse Management
Who knew running a greenhouse required so much math? Amaze future mathematicians and farmers with the amount of unit conversions, ratio and proportional reasoning, and geometric applications involved by having them complete the...
Virginia Department of Education
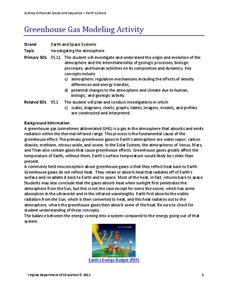
Greenhouse Gas Modeling Activity
Why are greenhouse gases called greenhouse gases? Young Earth scientists learn about greenhouse gases though experimentation in the second installment of a 3-part series. They use lamps to model radiant energy as well as warming through...
Curated OER
Integration and the "Barrier Breakers": Black Baseball 1945-1960
Students explore integration of Major League Baseball, identify important individual baseball players who played key roles in integration, and analyze historical information through charts, graphs, and statistics.
Curated OER
Candy is Dandy
Students investigate color distribution in bags of M&Ms They sort and classify the contents of a bag of M&Ms and summarize their findings on a worksheet. Students convert the numbers into charts and make predictions about color...
Curated OER
Jelly Belly: What a Wonderful "Bean"!
Students explore how jelly beans are produced. They discuss the origins of the jelly bean and view a video about how jelly beans are prepared, tested, shaped, finished, and shipped and estimate the amount of jelly beans in a jar and sort...
Curated OER
The ABC's of Industry
Students define and explore Industry. They access times during the Industrial Revolution in America. Students view how business functions in any economy. They summarize the three sectors of industry by creating and interpreting a web...
Curated OER
Cold Enough?
Students read and record temperatures and display the data. They represent the temperatures on an appropriate graph and explain completely what was done and why it was done. Students display the data showing differences in the daily...
Curated OER
Data Collection and Presentation
Students concentrate on discrete quantiative data. They are shown that the vertical line diagram as a more appropriate way to present discrete quantiative data then bar charts. Students work as a group to help with the interpretation...
Curated OER
Evaluating Data
In this data worksheet, students learn how to organize the data collected during an experiment and practice finding patterns. Students graph a table of experimental data and complete 1 short answer question.


