Curated OER
Center of Mass
Students identify the geometric mean of their data. In this statistics lesson plan, students collect data and graph their findings. They identify the mean, range and mode.
Creative Learning Exchange
The Infection Game: The Shape of Change
Encourage the spread of knowledge in your class with this cross-curricular epidemic simulation. Pulling together science, social studies, and math, this lesson engages students in modeling the spread of infectious diseases, collecting...
Virginia Department of Education
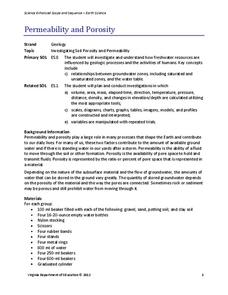
Permeability and Porosity
Covering both permeability and porosity, scholars perform a hands-on experiment testing various soil types. The material includes a pre-lesson worksheet to help focus pupils on the task at hand.
Curated OER
Tech Algebra: A Statistics Study
Students use the internet to gather a minimum of thirty pieces of data. Students create box and whisker graphs, and stem and leaf plots from the information. They calculate mean, median, mode, and range. Students write a summary and...
Curated OER
Statistical Accuracy and Reliability
Ninth graders assess the accuracy and reliability of current survey data and how it is represented. They design a survey, collect data, and use technology to analyze the data and present the results. Students examine scatter plots and...
Curated OER
Not Everything Is More Expensive
Students investigate the concept of using different types of presentations to help solve mathematical problems. They research the use of illustrations to help understand data and its interpretation in a graphing format. Students also...
Curated OER
Discovering Different Types of Functions
Graph polynomials and identify the end behavior of each polynomial function. The class differentiates between linear, quadratic, and other polynomial equations.
Curated OER
Analysis of Atmospheric Conditions for a High Mountain Retreat
Students examine the relationship between altitude, atmospheric pressure, temperature and humidity at a particular location. They practice science and math in real world applications. They write reports detailing their scientific...
Curated OER
Death by Particles
Emerging epidemiologists define relative risk and read an article about the effect of particulate pollution on the cardiovascular health of women. They record the relative risk values, graph them, and answer analysis questions. This is a...
Curated OER
What is a Seed?
First graders identify the parts of a seed. In this plant biology lesson, 1st graders are given a seed and identify each part of the seed by using a hand lens. Students plant a seed and graph the growth.
Curated OER
Between The Extremes
Students analyze graphs for specific properties. In this algebra lesson, students solve equations and graph using the TI calculator. They find the different changes that occur in each graph,including maximum and minimum.
Curated OER
Using Non-Text Features
Second graders examine graphs and charts from their local newspaper. As a class, they discuss what the data means and how it relates to the article. In groups, they are shown two sets of graphs or charts and they practice explaining...
Curated OER
When Am I Ever Going to Use this?
Young scholars solve problems using equations and properties of integers. In this algebra lesson, students solve problems using ratio and proportion and graph their answers on a coordinate plane. They solve word problems using geometry.
Curated OER
Valentine Candy Count
Young scholars investigate what color Valentine Candy is found more often than any other in a standard bag of "Valentine Conversation Hearts." They sort, classify and graph their findings.
Curated OER
FUN WITH MAPS
Fifth graders learn map skills by showing the routes they travel from home to school and using that data to practice map reading and interpreting geographical information.
Curated OER
Absolute Maximum and Minimum
Students calculate the maximum and minimum of each function. In this algebra lesson, students collect and graph data to analyze it. They differentiate between the absolute max and min and the maxima and minima of each function.
Curated OER
Observing and Predicting Weather from a Weather Station
Fourth graders us a Weather Log data chart to record the date, time, day, and weather. They discuss different instruments and charts needed to record the information. Students turn in their weather logs at the end of two weeks and...
Curated OER
Porosity and Permeability
Students examine the concepts of porosity and permeability. They conduct experiments to determine the porosity and permeability of gravel, sand, and clay. After performing the experiments they collect and graph data, comparing the...
Curated OER
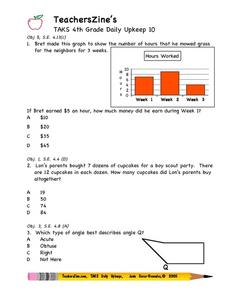
TAKS 4th Grade Daily Upkeep 10
In this math worksheet, 4th graders look for the answers to basic review problems that focus upon the skills of reading simple word problems, and applying the interpretation of data.
Curated OER
Identifying Lines of Symmetry
Students calculate the lines of symmetry using polygons. In this geometry instructional activity, students graph, compare and estimate using collected data. They identify different attributes to the polygons based on their sides.
Curated OER
Studying Special Segments in Triangles
Students investigate special segments in triangles. For this geometry lesson, students graph, compare, estimate and predict findings based on their data. They differentiate between similarity and congruence of triangles.
Curated OER
Bar Me In
Fourth graders watch a video about constructing bar graphs. They create their own graph and interpret it.
Curated OER
Tony's Spelling Troubles
Students are introduced to the given problem and describe in their own words the situation represented in a bar chart and tally chart. They then use a bar chart and tally chart to make sensible predictions.
Curated OER
Manatee Awareness Survey
Students examine the public's awareness of manatees by taking a survey. They display the results of the survey as a graph.


