Curated OER
Kindergarten Money
Students identify the various coins and their values through presentations, a rubric, a value pretest, and coin manipulatives. Money is incorporated into various activities whether at home or in school. Students create money webs using...
Curated OER
Weather... Or Not
Students observe and discuss the local weather patterns, researching cloud types and weather patterns for cities on the same latitude on the Internet. They record the data for 6-8 weeks on a graph, and make weather predictions for their...
Curated OER
Absolute Value of Linear Functions
Students identify and interpret how absolute value affects linear functions. They also graph linear functions and reflect them in a line of symmetry. Finally, students evaluate the absolute value of a constant using technology to...
Curated OER
Radiation Comparison Before and After 9-11
Using the NASA website, class members try to determine if changes could be detected in cloud cover, temperature, and/or radiation measurements due to the lack of contrails that resulted from the halt in air traffic after the attacks of...
American Statistical Association
Exploring Geometric Probabilities with Buffon’s Coin Problem
Scholars create and perform experiments attempting to answer Buffon's Coin problem. They discover the relationships between geometry and probability, empirical and theoretical probabilities, and area of a circle and square.
Curated OER
Best Guesser
Fifth graders develop strategies for estimating ages, and illustrate results by graphing and interpreting scatter plots to compare x and y coordinates.
Curated OER
Record 'The' Results
Third graders predict how many times they'll see the word "the" in a newspaper page and highlight all the "the"s they find. After reviewing definitions of range, median, mode, mean they create a Stem and Leaf Plot and a Back-to-Back Stem...
Curated OER
How Do You Get Home from School?
First graders create pictographs and interpret results of transportation home from school.
Curated OER
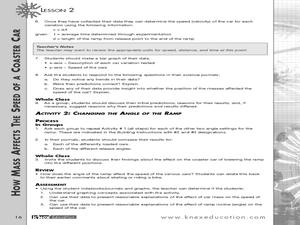
How Mass Affects the Speed of a Coaster Car
Students determine what factors affect the speed of the car. In this physics lesson, students calculate speed, velocity and acceleration from experimental data. They construct and interpret motion graphs.
Curated OER
The Great Pollinators
Students discover the reproductive parts of a plant. In this biology instructional activity, students identify and categorize several different plants they dissect in class. Students record their information using a data chart.
Curated OER
Choosing a Summer Job
What did you do over your summer vacation. Young wage earners must compare summer job options, and determine when each job earn the same amount and what that amount be. This be done by creating, graphing, and solving systems of...
Curated OER
Cell Phone Plans
Students relate the use of a cell phone to math. In this algebra lesson, students collect data on the usage of their phones and plot it. They analyze the graph and make predictions based on the rate per minute.
Curated OER
"Go-Car" Lab
Young scholars construct a car based on directions given. In this physics lesson, students calculate average speed using distance and time information. They collect data and create a graph of distance vs. time.
Curated OER
The Stock Market-Tracking and Picking Stocks
Students interpret the stock market. They pick preferable stocks based on price to earnings ratios listed in the quotes. They practice using fractions and decimals to calculate the cost of selling and buying various stocks using...
Curated OER
What Color is Your Air Today?
Students investigate air quality. They analyze Air Quality Index data tables, interpret the graphs, complete a worksheet, and discuss trends in air quality.
Curated OER
Electromagnets: Winding Things Up!
Students explore solenoids and electromagnets. After building an electromagnet, students use a TI Graphing calculator, a CBL 2 interface and a magnetic field sensor to measure the strength of a magnetic field. They create a graph of...
Curated OER
Swinging
Students examine and modify a swinging apparatus. They describe the motion of an object by its position, direction of motion, and speed. Students measure motion using a graph.
Curated OER
Chicken Pox Math
Students will listen to a story of a boy with chicken pox and participate in a class discussion of chicken pox and what to do when you have a contagious disease. They will incorporate math by graphing who in the class has had the...
Curated OER
Chicken Pox Math
Second graders are read a story about a boy with chicken pox. As a class, they discuss what to do when you have a contagious disease and identify who in the class has had chicken pox. Using this information, they create a graph and use...
Curated OER
Groups Coming to America
Fifth graders use text or other references to locate different types of information about the Mayflower and pilgrims. They create a presentation for lower elementary classes about the Pilgrims.
Curated OER
Parts of a Plant
First graders discover the parts of a plant. For this science lesson, 1st graders identify and label the parts of a plant and record their findings on a word processor.
Curated OER
Linking Algebra to Temperature
Students convert between two units as they calculate the temperature. In this algebra lesson, students collect data on seasonal climate and create a graph. They make conjectures based on their data collection.
Curated OER
Relating Distance and Velocity Over Time
Students calculate the distance and velocity over time. In this algebra lesson, students graph a linear function to represent the distance vers time travel. They interpret their graphs and draw conclusion.
Curated OER
Mathematical Magazines
Students look through magazines and calculate the percentages of the types of ads in the magazines. In this percentages lesson plan, students create a graph to show their results.


