Curated OER
Scientific Notation II: The Mantissa
Students after completing the Part II (of 2) scientific notation online lab exercises, manipulate and interpret large numbers expressed in the "mantissa and exponent" format of scientific notation.
Curated OER
Scientific Notation I: The Exponent
Students manipulate and interpret large numbers expressed in the "exponent" format of scientific notation.
Curated OER
Natural Resources
Fifth graders begin the lesson by identifying the different types of natural resources. As a class, they discuss how environments are destructed and how the loss of one natural resource can affect the economy. Using a map, they label the...
Curated OER
Using Tiles to Solve Word Problems
Young scholars solve problems using equations. In this algebra instructional activity, students identify the correct symbols and steps when solving word problems. They graph their lines and analyze the slope using tiles.
Curated OER
The ABC's of Industry
Students define and explore Industry. They access times during the Industrial Revolution in America. Students view how business functions in any economy. They summarize the three sectors of industry by creating and interpreting a web...
Curated OER
Finding Percent When Given A Fraction
Seventh graders calculate percentages when given a fraction. They convert a percentage to a fraction. All of this be done by each student's ability to read the graphs made available by the spreadsheet information.
Curated OER
Cool Times with Heat
Learners work with thermometers to complete problems about temperature. They investigate cooling patterns, how location affects temperature, and what happens when water having different temperature is mixed. They measure temperature in...
Curated OER
Exponential and Exponents Functions
Students solve problems using exponential properties. In this algebra lesson, students differentiate between exponents, exponential and log functions. They graph their functions using table and exponents.
Curated OER
Do Vampires Really Exist?
Learners identify and extend a number pattern into very large values. They create and interpret a graph based on their number patterns. Students compare a math model with real-world statistics about the existence of vampires.
Curated OER
Exploring the Slopes of Parallel and Perpendicular Lines
Students calculate the slope of parallel and perpendicular lines.In this algebra lesson, students differentiate between parallel and perpendicular lines. They graph their lines using the slope of the equation.
Curated OER
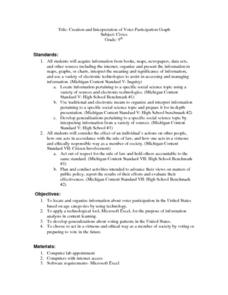
Creation and Interpretation of Voter Participation Graph
Ninth graders research information about voter participation in the United States based on age. They develop generalizations about voting patterns in the U.S and use Microsoft Excel to analyze the information.
Curated OER
Baseball Statistics
Students take an in depth examine baseball record breakers. They calculate statistics, not just for one year, but over whole careers, to compare some famous players and find who was the best all-time home run hitter.
Curated OER
Graph Both Crusts
Fourth graders calculate the angles and construct a pie graph of the percentages of the elements in the continental and oceanic crusts. Then they analyze the results. They can be assigned the task of researching the percentages.
Curated OER
Picture Fists Full of Kisses
Ease children's back-to-school jitters with this primary grade lesson plan based on the book The Kissing Hand by Ruth E. Harper. Starting off with a singing of the song "I Wish I Had a Little Red Box", children go on to discuss and...
Curated OER
Heart Smart in a Heart Beat
As an introductory activity, young statisticians measure their heart rate at rest and after exercise and compute the mean and median, and create a box & whisker plot. This is followed by watching a video (that no longer seems to...
Curated OER
Box Plots on the TI-83 Calculator
Eighth graders research box plots on the Internet. They gather real life statistics and analyze the collected statistics by making multiple box plots on the TI-83 calculator.
Curated OER
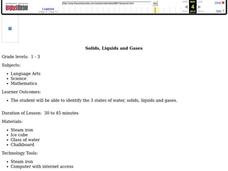
Solids, Liquids and Gases
Students explore solids, liquids, and gases. In this states of water lesson plan, students conduct a scientific investigation that requires them to observe and note the differences among solid, liquids, and gases.
Curated OER
Environmental Mathematics
Eighth graders determine food that they would need to survive in the wild. They graph the best foods for their environments and rate the survivability rate for each member of their group.
Curated OER
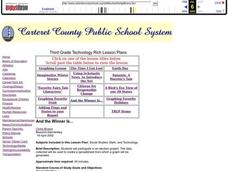
And the Winner Is...
Third graders participate in an election project. They collect data to create a spreadsheet from which a graph is generated.
Curated OER
A FOREST'S PLACE IN OREGON
Students engage in a lesson to find the purpose for the forests of Oregon. The role of the forest is researched according to different geographic perspectives. The information is portrayed in graphs and presented by group members to...
Curated OER
Weather for Health
Ninth graders encounter various types of numerical information (represented in multiple ways), much of which is abstract and difficult to comprehend. In this lesson, 9th graders will convert given information into bar graphs. In the...
Curated OER
One Square Foot
Students identify, describe, count, tally, and graph life found in one square foot of land.
Curated OER
The Cost of Life
Students research the salary for a career of interest. They consider what kind of lifestyle that career would provide and graph their information for comparison.
Curated OER
Do You Have a Coin Collection?
Learners create a graph showing which students in the class collect coins.


