Curated OER
Porosity and Permeability
Students examine the concepts of porosity and permeability. They conduct experiments to determine the porosity and permeability of gravel, sand, and clay. After performing the experiments they collect and graph data, comparing the...
Curated OER
Potential Energy: How is It Related to Kinetic Energy?
Young scholars explore kinetic and potential energy. In this energy lesson plan, students launch toys cars from ramps in order to examine the relationship between potential energy and kinetic energy. Young scholars collect data and graph...
Curated OER
Saving Money Through Mathematics
Third graders discuss light sources and collect data about energy sources. They compare data and create a multiple line graph showing energy used by light sources for each student in the group. They present their graphs and write a...
Curated OER
Using Non-Text Features
Second graders examine graphs and charts from their local newspaper. As a class, they discuss what the data means and how it relates to the article. In groups, they are shown two sets of graphs or charts and they practice explaining...
Curated OER
Determination of Tensile Stress-Strain Common Properties in Materials
Young scholars demonstrate the relationship between stress and strain, then graph stress-strain curves for various common materials. Students interpret graphed results and discuss differences in mechanical properties of materials.
Curated OER
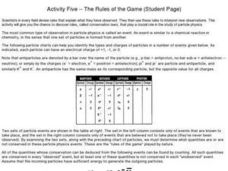
Particle Physics- Activity Five
In this particle physics worksheet, students use graphs and tables to predict the particles formed during a specific observation event. They complete 5 multi-part fill in the blank questions.
Curated OER
A Tasty Experiment
Students work together to determine if smell is important to being able to recongize food by taste. They try different foods with different textures and hold their nose. They create a graph of their results.
Alabama Learning Exchange
The State Capital of Stem and Leaf
Students explore the concept of stem and leaf plots. In this stem and leaf plots lesson plan, students plot the 50 US states' capitals on a stem and leaf plot according to the first letter of each state. Students compare their stem and...
Curated OER
Organising Data
Students complete data organization activities. In this data organization lesson, students watch online clips about organizing data. Students complete an eye color frequency table for their class. Students watch a clip about asking...
Curated OER
Bird Feeding and Migration Observation
Students research bird migration and build a bird house. In this bird lesson plan, students research the birds in their area and where they migrate to. They also build their own bird house and record data on what kinds of birds come to...
Curated OER
Stemmin'-n-Leafin'
Learners make stem and leaf charts to determine the measures of central tendency using test score data. They analyze the data to draw inferences which they share with the class. They complete the associated worksheets.
Curated OER
My Peanut Butter is Better Than Yours!
Students explore the concept of statistical data. In this statistical data lesson, students read an article about the dangers of peanut butter to those who are allergic. Students perform a taste test of two different brands of peanut...
Curated OER
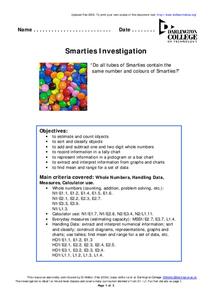
Smarties Investigation
In this math worksheet, students participate in an investigation of Smarties candy. For example, students estimate how many candies they have in each color, count the actual number, and record the information in a tally chart.
Curated OER
The Great Chile Challenge
Fifth graders gather data, create a graph, and interpret information. They build vocabulary by negotiating the ideas that go into the graphs which they create. They use Excel to print a variety of graphs based on how much they like Chile...
Curated OER
Checking County Numbers
Learners use their county's information page to gather information about their community. Using the information, they create graphs from the tables provided and interpret the data. They write a paragraph showing their interpretation of...
Curated OER
Environmental Mathematics
Eighth graders determine food that they would need to survive in the wild. They graph the best foods for their environments and rate the survivability rate for each member of their group.
Curated OER
And the Winner Is...
Third graders participate in an election project. They collect data to create a spreadsheet from which a graph is generated.
Curated OER
Extraordinary Compilations
Students discuss and record why people have various types of collections. They interpret the class collection of information then use details about the Morgan Dollar to understand what collection characteristics it may have.
Curated OER
Streamflow
Learners discuss the topic of streamflow and how it occurs. They take measurements and analyze them. They interpret data and create their own charts and graphs.
Curated OER
The Stock Exchange Phase I
Second graders select a stock and follow its ups and downs, using graphs to show its success.
Curated OER
A Real Difference
Fifth graders use the Celsius and Fahrenheit thermometers to compare temperature readings. They use the Internet to find the temperatures of selected cities. After data is collected for five days, 5th graders graph the temperatures.
Curated OER
Space: The Final Frontier
Sixth graders construct a graph to demonstration information that they've learned about the solary system. They also write or illustrate a sonar or lunar eclipse.
Curated OER
One Square Foot
Students identify, describe, count, tally, and graph life found in one square foot of land.
Curated OER
What's Your Expression
First graders explore facial expressions in a mirror and create drawings of people with a facial expression of their choice. They graph the facial expressions drawn.


