Curated OER
My Test Book: Reading Graphs
In this online interactive math skills worksheet, students solve 10 multiple choice math problems that require them to read and interpret graphs. Students may view the correct answers.
Curated OER
Graphing Data Brings Understanding
Students collect, graph and analyze data. In this statistics lesson, students use circle, pie, bar and lines to represent data. They analyze the data and make predictions bases on the scatter plots created.
Curated OER
Money Circulation: A Story of Trade and Commerce
Middle schoolers are introduced to the meaning, symbolism, and value of the quarter. They determine the percentage of total monetary value held in quarters and graph the results. Students infer about the U.S. Mint's distrubution of...
Curated OER
Problem Solving: Use a Graph 3
In this math problem solving worksheet, students examine a graph based on books read and use it to solve 2 problem solving questions and a test prep question.
Curated OER
Statistics of Mars
Students explore the concept of central tendencies. In this central tendencies lesson, students sort M&M's or Skittles based on color. Students graph their results. Students find the mean, median, and mode of their data.
Curated OER
Graphs: All About Our Class
Students respond to survey questions, discuss results, brainstorm ways to represent survey information, and create table of class results. They find mean, range, and percentages, and create graph to display results.
ARKive
Handling Data: African Animal Maths
Handling and processing data is a big part of what real scientists do. Provide a way for your learners to explore graphs and data related to the animals that live on the African savannah. They begin their analysis by discussing what they...
Noyce Foundation
Granny’s Balloon Trip
Take flight with a fun activity focused on graphing data on a coordinate plane. As learners study the data for Granny's hot-air balloon trip, including the time of day and the distance of the balloon from the ground, they practice...
Curated OER
Jim, Tony, and Frank - The School Fundraiser
In this bar graph worksheet, students use the horizontal bar graph to count how much money each student collected for their fundraiser. Students answer 10 questions.
Curated OER
The Bread Shop
In this bar graphs worksheet, learners study the bar graph to count the money Adam made during each day. Students answer 10 questions.
Curated OER
Tim and Pat - At the Store
In this bar graphs worksheet, students use the bar graph to add how much time Tim and Pat spend buying candy each week. Students complete the table and answer 3 questions.
Curated OER
Jim, Tony and Frank - The School Fundraiser
In this bar graphs learning exercise, students use the bar graph to count how much money students collected during a weekend fundraiser. Students answer 10 questions.
Curated OER
Understanding Statistics
In this statistics worksheet, students examine and interpret pictographs and line graphs. Students analyze the provided data in order to create bar graphs, circle graphs, and box and whisker plots. The nine page worksheet accompanies a...
Curated OER
Box and Whiskers
Middle schoolers discover how to relate collected data with a box and whiskers graph in a number of formats. They collect, organize, create, and interpret a box and whiskers graph. Pupils interpret the difference between sets of data,...
Curated OER
The Gathering and Analysis of Data
Young mathematicians gather data on a topic, graph it in various forms, interpret the information, and write a summary of the data. They present their data and graphs to the class.
Curated OER
The Tale of Scale
Eighth graders, using a range of data, produce three bar graphs for various scales along the y-axis.
Curated OER
Twelve Days of Christmas
Learners create charts and graphs using a spreadsheet. They chart the number of each gift given day by day from the song, "The Twelve Days of Christmas." They create a bar graph and a circle graph from their data on the spreadsheet.
Curated OER
Tony's Spelling Troubles
Students are introduced to the given problem and describe in their own words the situation represented in a bar chart and tally chart. They then use a bar chart and tally chart to make sensible predictions.
Curated OER
E3 Practice Assessment - Pets
In this assessment worksheet, 3rd graders complete eight pages of math assessment. Students solve problems related to money and a bar graph. Students solve word problems involving rounding and computation.
Curated OER
Historical Population Changes in the US
Students conduct research on historical population changes in the U.S. They conduct Internet research on the Historical Census Data Browser, create a bar graph and data table using a spreadsheet program, and display and interpret their...
Curated OER
Graphing Favorite Holidays
Students create spreadsheets and bar graphs based on results of survey of favorite holidays.
Curated OER
Effects of chemical use in Agriculture
Students research environmental data to create a bar graph. In this agricultural ecology lesson, students research the pros and cons of chemical use in farming. Students debate on passing a law to reduce chemical use.
Curated OER
Mr. Brown's Pet Store
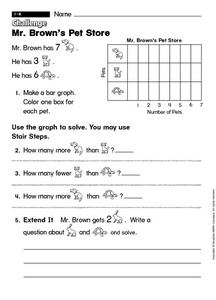
For this early childhood problem solving worksheet, students make a bar graph with the provided information and then use the graph to solve 4 problems.
Georgia Department of Education
The Basketball Star
Have learners use math to prove they are sports stars! Assess a pupil's ability to create and analyze data using a variety of graphs. The class will be motivated by the association of math and basketball data.


