Curated OER
Velocity Effects Problem Set
Students, after reading an explanation on lift from a NASA Web-based textbook and an explanation on the FoilSim software package given below, use FoilSim to evaluate the relationship between velocity and lift.
Curated OER
Airspeed Problem Set
Students demonstrate an understanding of aircraft launch airspeed requirements. They read a selection on relative velocities from a NASA Web-based textbook, then calculate airspeed launch requirement problems.
Curated OER
Calculating Range for a Constant Velocity
Students read an explanation from the NASA Web-based "textbook", The Beginner's Guide to Aerodynamics, then use the information in combination with data from other Web sites to solve single variable equations for distance (range), time,...
Curated OER
The Coral Reef
Fourth graders discuss life in a coral reef, and view photographs and a computer program about coral reefs. They design and create colorful watercolor, ink, and crayon drawings of coral reefs.
Curated OER
"Czech It Out" - A Look at Eastern Europe
Students research several countries in Eastern Europe. Students compare and contrast several Eastern European countries and then choose a specific country to research and prepare a class presentation with their findings.
Curated OER
Science: Hurricanes As Heat Engines
Students conduct Internet research to track the path of Hurricane Rita. They record the sea surface temperature of the Gulf of Mexico during and after the hurricane and draw conclusions about how hurricanes extract heat energy from the...
Curated OER
Oregon Rainshadows
Students brainstorm list of possible highest locations in Oregon, identify and label places from list on map using color code, and discuss and identify causes of a rain shadow.
Curated OER
Tortillas
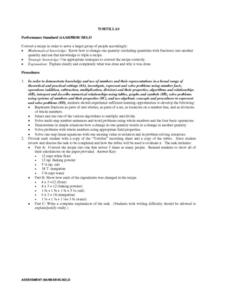
Middle schoolers convert recipes for tortillas. They calculate the amounts of ingredients as they convert recipes and write an explanation of the task to demonstrate their calculations. After reviewing their calculations, they...
Curated OER
Eye From the Sky
Students are introduced to the concept of aerial perspective and scale. Students will use satellite technology to view their neighborhoods and sketch the area surrounding their schools. They will take part in a neighborhood walk to view...
Beacon Learning Center
Beacon Learning Center: Interpreting Line Graphs
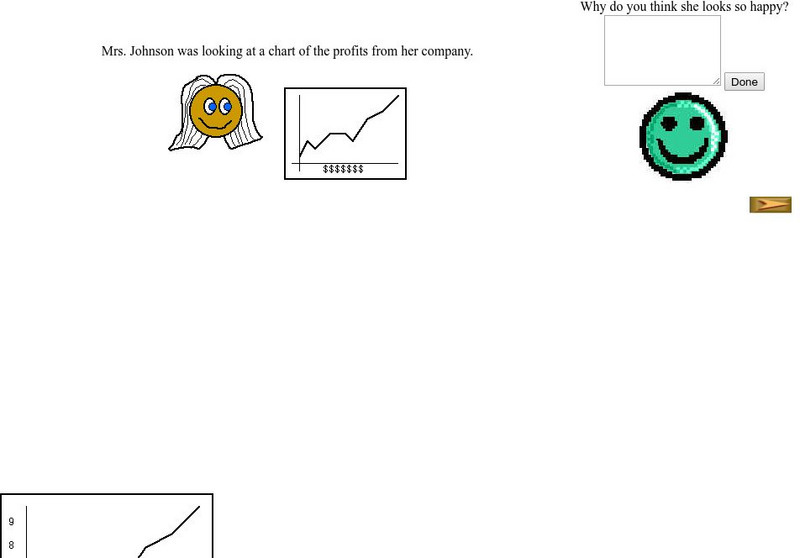
This site is a lesson on creating and interpreting a line graph. It explains how a line graph is created and then asks questions about what is learned from the data. Students type in open responses, and answers and feedback follow.
CK-12 Foundation
Ck 12: Statistics: Broken Line Graphs
[Free Registration/Login may be required to access all resource tools.] Covers creating and interpreting broken-line graphs.
CK-12 Foundation
Ck 12: Statistics: Double Line Graphs
[Free Registration/Login may be required to access all resource tools.] Construct and interpret double line graphs.
Beacon Learning Center
Beacon Learning Center: Push Ups
This is a tutorial on line graphs including when, how, and why one might choose to use them and how to interpret the data when it is complete. This one is to reach a goal for the number of push ups needed to win the Presidential Fitness...
Government of Alberta
Learn Alberta: Math Interactives: Exploring Data Display and Graphs
This multimedia Learn Alberta math resource focuses on graphing data. In the video portion, students will see how math is involved in the display of merchandise in stores. The accompanying interactive component provides an exploration...
E-learning for Kids
E Learning for Kids: Math: Orange Trees, Olive Trees: Line Graphs
Explore even and odd numbers, fractions, counting, and line graphs with Scott amidst the olive and orange trees.
Texas Education Agency
Texas Gateway: Analyze Graphical Sources: Practice 2 (English I Reading)
This lesson focuses on practice exercises to understand and interpret the data in a graphic representations including pie charts, bar graphs, and line graphs.
PBS
Pbs: Location Graphs
Use your skills of deduction to fill in the missing information and demonstrate your expertise at interpreting graphs. This interactive exercise focuses on how line graphs can be used to represent data and provides an opportunity to...
PBS
Pbs: Interpreting Stories and Graphs
This interactive exercise focuses on how line graphs can be used to represent mathematical data and provides an opportunity to translate actions from a story into graph form, then to write your own story to coincide with a line graph.
PBS
Pbs Learning Media: Graphs, Charts, and Tables: Targeted Math Instruction
At the end of this lesson about graphs, charts, and tables, students will be able to interpret and compare data from graphs (including circle, bar, and line graphs), charts, and tables.
CK-12 Foundation
Ck 12: Graphing
[Free Registration/Login may be required to access all resource tools.] Given a set of data, students will understand how to correctly draw a line or bar graph, interpret its patterns, and find the slope in the case of a line graph.
The Franklin Institute
Frankin Institute Online: Group Graphing
This site from The Franklin Institute explores how to make a simple graph using a spreadsheet to portray survey data. It also gives a set of interesting sports-related web sites so that students can get statistical inforamtion.
Texas A&M University
Wtamu Virtual Math Lab: Beginning Algebra: Reading Graphs
A good introduction to reading bar, line, and double line graphs, and drawing and reading Venn diagrams. Contains definitions and examples of these types of charts and graphs as well as practice exercises that ask you to answer questions...
Texas Education Agency
Texas Gateway: Analyze Graphical Sources: Practice 2 (English I Reading)
You will look at each of these types of graphs: bar graph, line graph, pie charts, as you work your way through the lesson.
University of Illinois
University of Illinois: Earthquakes of the World
Resource contains a lesson plan that utilizes data from earthquakes. Students are instructed to analyze and interpret line graphs that display the earthquake data.


