Math Worksheets Land
Halloween Interpreting Pictograph
The best part about Halloween is the candy. Individuals read a pictograph that depicts the amount of candy five children received. Then, they respond to five questions using the picture graph to support their answers.
Curated OER
Read a Picture Graph
It's the Bears vs. the Seals! Who is the season winner? Read this data and have your math class answer the six questions that follow. Consider graphing the chart as a class, or encouraging individuals to graph it before answering the...
Fuel the Brain
Interpret Pictographs
Have your youngsters use a graphic organizer and key to solve the following questions. By learning to interpret the pictographs, they will solve the problems accurately.
Curated OER
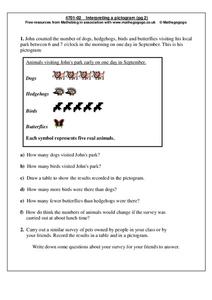
Interpreting a Pictogram
In this pictogram worksheet, students read and analyze a pictogram about dogs, hedgehogs, birds and butterflies and then answer 6 short answer questions. Students conduct a similar survey on pets owned by their friends and put their...
Curated OER
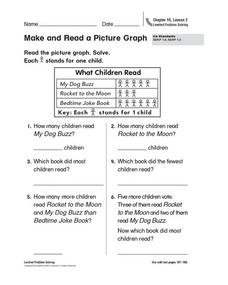
Make and Read a Picture Graph
What books do you like? Have your learners read and interpret a picture graph detailing a fictional class's favorite books. Consider conducting a survey of your learners' favorite books and plotting the results as a class!
Curated OER
Where Did the Bunny Leave the Eggs? Picture Graphing Activity
The Easter Bunny left us a bunch of eggs, but how many did he leave? Learners use the data to create a picture graph, interpret it, and answer the questions that follow. There's even easy egg cut-outs for your youngsters!
Curated OER
Picturing Hats
In this pictographs activity, students examine a pictograph then solve 11 problems related to the data in the pictograph. Students cross out problems that do not relate to the pictograph.
Mathed Up!
Pictograms
Young mathematicians read, interpret, and complete a variety of real-world pictograms. Each question includes a key and information to complete the graphs.
Curated OER
Interpreting a Pictogram
In this pictogram worksheet, students interpret a pictograph on ladybirds and answer 5 short answer questions or drawings referring back to the pictogram. Students carry out their own scenario pictogram and draw a table with their results.
Curated OER
Use a Graph
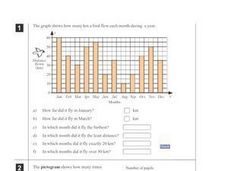
Information is often presented in graph form. Can your youngsters read a basic bar or picture graph? Six word problems accompany three graphs. One graph is a bar graph and the other two are pictographs.
Curated OER
Understanding Statistics
In this statistics worksheet, students examine and interpret pictographs and line graphs. Students analyze the provided data in order to create bar graphs, circle graphs, and box and whisker plots. The nine page worksheet accompanies a...
Curated OER
What's Your Favorite Fruit?
A sweet activity to challenge your first graders! The picture graph displays a class's favorite fruits. Young learners solve various problems with the data, including counting the amounts of each kind of fruit, and interpreting which...
Curated OER
Pictograph Activity
In this pictograph worksheet, learners learn to read a pictograph and answer questions based on the data. Students then draw two of their own pictographs using the given information and answer questions based on graphs.
Curated OER
Graphs and Pictograms
In this graphs and pictograms instructional activity, students analyze both a graph and a pictogram and then answer 11 questions about them. Students can click on the Check button to determine whether their answers are correct or not.
Curated OER
Frequency, Histograms, Bar Graphs
In this statistics worksheet, students plot and graph their data, then interpret the data using the correct form of graphs. There are 3 detailed questions with an answer key.
Curated OER
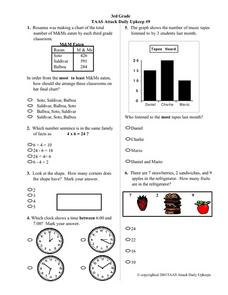
3rd Grade TAAS Attack Daily Upkeep #9
For this math literacy worksheet, 4th graders practice interpreting the pictographs in order to assemble the information to find the solutions to the 13 problems.
Curated OER
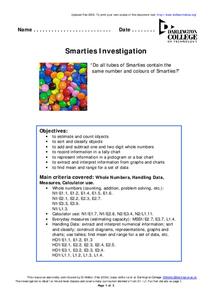
Smarties Investigation
In this math worksheet, students participate in an investigation of Smarties candy. For example, students estimate how many candies they have in each color, count the actual number, and record the information in a tally chart.
Government of Alberta
Learn Alberta: Math Interactives: Exploring Election Data
Using actual Alberta provincial election results, students have the opportunity to interpret election data using a variety of graph types. Pictographs, line graphs, bar graphs, circle graphs, and data tables are covered in this...


