Scholastic
Hill of Fire Teaching Plan
Some books are perfect for drawing connections between multiple subjects. The book Hill of Fire becomes the hub for three very different, yet related activity ideas. First the class hones their oral language skills by creating an...
Monroe City Schools
Clouds! Clouds! Clouds!
Here is a beautiful lesson on clouds designed for your 1st graders. Learners study three different types of clouds. They construct drawings of cumulus, cirrus, and stratus clouds. The Cloud Book, by Tommie dePaola is used to introduce...
Curated OER
My Secret War: Lesson 1
Fifth graders explore historical fiction. In this genre study lesson plan, 5th graders go on a text feature scavenger hunt to identify the parts of a historical fiction text. Additionally, students read the book, My Secret War and...
Odell Education
Scientific Process and Experimental Design
The scientific method keeps you from believing only what you want to believe — it expands your mind. The lesson introduces the eight steps in the scientific process and how to design an experiment to biology scholars. Live insects...
EngageNY
An Appearance of Complex Numbers 2
Help the class visualize operations with complex numbers with a lesson that formally introduces complex numbers and reviews the visualization of complex numbers on the complex plane. The fifth installment of a 32-part series reviews the...
Statistics Education Web
The United States of Obesity
Mississippi has both the highest obesity and poverty rate in the US. Does the rest of the data show a correlation between the poverty and obesity rate in a state? Learners tackle this question as they practice their skills of regression....
Curated OER
Unit 2: Lesson 7
Students are introduced to spreadsheets. They conduct a survey of television viewing time of different shows based on different age categories. Students work in small groups. They collect, data and interpret the data from a survey.
Curated OER
Graphosaurus
Students complete bar graphing activities with a dinosaur theme. Students discuss their favorite dinosaurs, collect data about the discussion, and make a floor graph of the information. Students complete a dinosaur graph worksheet.
Curated OER
Education for Global Peace
Fifth graders construct data graphs based upon sets of data. In this graphing instructional activity, 5th graders read the text If the World Were a Village and discuss how types of graphs accurately represent a large population. Students...
Curated OER
Get the Picture?
Students explore the movement to design low-cost solutions for the world's population and create a graph to represent the information. In this design and graphing lesson, students review the concepts of graphing and visit the...
Curated OER
The 400-Meters Race
Students collect and graph data. In this algebra lesson, students describe, interpret and analyze data. They follow a 400 meters race and plot the coordinates of the course. They graph a line to represent the data of the course.
Curated OER
Lesson 3: Vary Your Veggies and Focus on Fruits
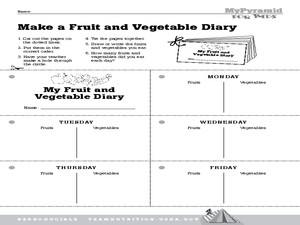
Young scholars explore fruits and vegetables. In this nutrition lesson, students generate a list of all known fruits and vegetables. Young scholars cut out and compile pages for a weekly fruits and vegetable journal. Students complete...
Curated OER
Radioactive Decay
Students generate a radioactive decay table for an imaginary element, use their data to plot a decay graph, develop the concept of half-life, and use the graph to "age" several samples.
Curated OER
Apple Logic and Problem Solving
Students examine apple production in the United States. In this interdisciplinary lesson, students use problem solving strategies introduced to solve math problems associated with apple production in the United States. Student collect...
Curated OER
Graphing Linear Equations
Ninth graders develop an understanding of and the applications for linear equations and their graphical displays. They participate in a cooperative learning activity of matching a graphic display with an equation.
Curated OER
Graphs and Functions
Students are introduced to plotting functions on the Cartesian coordinate plane seen several categories of functions, including lines and parabolas
Curated OER
Cloud Observation and Graphing
Students identify the three major cloud groups. They are introduced to the three main cloud types and spend a week making and recording observations of clouds. Students produce a graph that presents their findings and conduct research...
Curated OER
Graphs
Students list their favorite cars and create graphs of their favorites. Students determine how the graphs would change as their choices change.
Curated OER
Topic 2: Graphing 2-Variable Linear Equations
Young scholars explore the concept of 2-variable equations and expressions. In this 2-variable equation and expression lesson, students translate 2-variable word problems into 2-variable equations and expressions.
Curated OER
M & M Madness
Second graders graph M & M's by color. In this graphing lesson plan, 2nd graders first predict how many of each color they think are in a handful of M & M's. Then they graph the amounts of each color on a computer program....
Curated OER
The Dog Days of Data
Learners are introduced to the organization of data This lesson is designed using stem and leaf plots. After gather data, they create a visual representation of their data through the use of a stem and leaf plot. Students
drawing...
Curated OER
The Seasonal Round and The Cycle of Life
Fourth graders are introduced to the concept of the seasonal round and how folklife traditions vary from season to season. They begin charting dates of personal interest on seasonal round calendars by starting with birthdays. Students...
Curated OER
Location, Location, Location: Using a Grid to Determine Context
Seventh graders are introduced to making inferences about artifacts. Using a grid system, they locate the artifacts and determine where they originated from. They use this information to make conclusions about the way people lived...
Curated OER
Celebrating the Solstice and Equinox
Fourth graders graph the number of daylight hors throughout the year and examine why day length varies. They discover that seasonal changes and latitude on Earth affect the number of hours of daylight in each day. Students listen to...


