Curated OER
Scientific Notation III: Linear vs Exponential
High schoolers examine the differences in exponential growth and linear growth of a system. They interpret data on graphs and develop their own charts. They answer discussion questions as well.
Curated OER
Buoyancy: What will float and what will sink
Students write and explain why an object sinks or floats. In this buoyancy lesson students demonstrate how items float or sink and graph the results.
Curated OER
CAN'T TOUCH THIS!
Young scholars discover the best practical shielding material when dealing with radioactive substances. They draw conclusions based on availability of materials, price, and best shielding properties.
Curated OER
Pie Charts
The teacher conducts a survey of each student's favorite color. The teacher then creates a pie chart identifying the information gathered. The students display mastery by creating their own pie chart displaying the same information.
Curated OER
That was Then, This is Now
Students compare and contrast data charts and statistics for food prices of now and in the past. In this food prices lesson plan, students answer short answer questions and calculate computations.
Curated OER
Using a Statistical Procedure To Search A Database For Out of the Ordinary Values
Young scholars develop a spreadsheet containing formulas and find summaries for them. In this investigative lesson students choose a topic, investigate it and use MS Excel to sort data.
Curated OER
Race the Track! Jump the Gap
Students record data of using a track system with variables and how those variables affect a ball used in the track. In this track lesson plan, students design their own track in groups, test the ball's rates of speed, and record their...
Curated OER
Count Down
Students are introduced to useing websites as a data source. Using bird population predictions, they test their predictions from various websites. They record, organize and graph the data and share their results with the class.
Curated OER
Hare and Lynx Population
Fourth graders study changes in animal population. In this graphing lesson, 4th graders create graphs from information read to them about hares and lynx populations. They will describe patterns of change in the graphs and discuss why...
Curated OER
Glacial Change
Students research the ways in which scientists study glaciers and glacial change. They interpret real time data and calculate the estimated global sea level rise potential. A very good lesson to illustrate global warming.
Curated OER
The Stock Exchange Phase I
Second graders select a stock and follow its ups and downs, using graphs to show its success.
Curated OER
The Mandelbrot Set
Young scholars explore the Mandelbrot Set. They are introduced to the concept of a complex number and function in order to motivate the discussion of Julia and Mandelbrot sets. Students investigate fractals and how they are built.
Curated OER
Lines, Rays, Line Segments, and Planes
High schoolers are introduced to lines, rays, line segments and planes and study the differences between them. They also practice graphing lines, rays, line segments and planes
Curated OER
Rich Kid Smart Kid Games
Students graph quantities to help explain the concept of pay yourself first, reinforce basic skills through the playing of bingo, and discuss the concept of charitable giving.
Curated OER
What's Your Favorite Stuffed Animal?
Second graders gather information in a survey and interpret the results using a tally chart, a table, and a bar graph. They' present their results of the during the final group discussion. The subject of the survey is favorite stuffed...
Curated OER
A FOREST'S PLACE IN OREGON
Students engage in a lesson to find the purpose for the forests of Oregon. The role of the forest is researched according to different geographic perspectives. The information is portrayed in graphs and presented by group members to...
Curated OER
How Low Can You Go?
Students are introduced to the concepts of elevation and slopes. Using Minneapolis and St. Paul, they graph elevation of various cities in a scenerio given to them. They also calculate the total miles traveled and organize the...
Curated OER
US Historical Climate: Excel Statistical
Students import US Historical Climate Network mean temperature data into Excel from a station of their choice. They are guided through the activity on how to use Excel for statistical calculations, graphing, and linear trend estimates.
Curated OER
A Pocketful of Change
Students study the meaning, symbolism, and value of U.S. coins,
especially the quarter. They conduct a survey of coins in students'
possession, graphing the results to show frequency distribution and drawing
inferences about the U.S....
Curated OER
The Bozeman Trail
Eighth graders are introduced to the Bozeman Trail. Using the internet, they research the trail to discover the forts located on its path. They must also locate and label landmarks on a map using symbols they create. They answer...
Curated OER
Canada and the Second World War
This lesson is designed to introduce students to Canada's role in World War II and the impact it had on Canadian society. It allows the opportunity to improve their research skills by selecting various pieces of information from a...
Curated OER
Aquaculture Production in the Classroom
High schoolers study the basics of aquaculture and how to successfully raise aquatic plants and animals. In this water lesson students perform water quality tests on fish tanks, record and graph their results.
Curated OER
Flip a Coin
Students are introduced to the concept of probability. In groups, they make a prediction about how many times a coin might show heads or tails when flipped. They carry out the experiment and record their results to compare it to their...
Curated OER
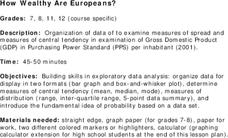
How Wealthy Are Europeans?
Students investigate measures of central tendency. They examine compiled data and conduct critical analysis. The graph is focusing on the gross domestic product data. The lesson also reviews the concept of putting values in order of...


