Curated OER
Exploring Transformations: Translations and Reflections
Learners perform translation and reflection. They identify the coordinate points of the new graph and create a formula for the movement. They identify the pre-image the and after image.
Curated OER
Families of Functions
Learners use sliders to change the parameters of functions and examine how shifting parameters affects a graph. They identify the parameters of functions, find vertical and horizontal stretches, then calculate the scale factor and other...
Curated OER
Domain and Range 2
How do you identify the domain and range of the function? As learners find out it's as easy as creating a graph. They'll identify the domain and range of a relation from its graph, write symbolic expressions describing the relationship...
Curated OER
Quadratic Functions and Stopping Distance
Students solve quadratic equations. In this algebra lesson, students factor and graph quadratic functions. they use the properties of quadratics to calculate the distance.
Curated OER
Polynomials: Factors, Roots and Zeroes
High schoolers factor polynomial equations. In this algebra lesson, students identify the zeros of the equations. They use algebra to rewrite word problems using symbols.
Curated OER
Exponential Transformations
Perform transformations on exponential functions! Teach your class how to perform dilation, compression, and translation. They graph exponential functions using the TI Calculator.
Curated OER
Logarithmic Transformations
Using the TI calculator to visualize and make predictions, high schoolers perform transformation vertically and horizontally on logarithmic graphs in order to solve problems.
Curated OER
Solving Exponential Equations
Solving exponential and logarithmic equations is taught in this interactive lesson. Students use properties of logarithm and exponents solve functions. They estimate the solution and use the Ti to find the exact solution.
Curated OER
Properties of Logarithms
Learners investigate properties of logarithmic function as they add, subtract and multiply logarithms. They graph and analyze the graph for exponential equivalency.
Curated OER
Permutations & Combinations
Young mathematicianss predict the outcome of an event. Learners solve problems using permutations and combinations. They use the TI calculator to see the different combinations and how the groupings occur.
Curated OER
Radian Measure
Young mathematicians identify central angles, arcs and radius of circles in this pre-calculus lesson. They identify the proportion of the circle based on its radius while they convert between degrees and radians measurements.
Curated OER
Parametric Projectile Motion
Learners relate projectile motion to parametric equations as they identify the velocity and angle of a projectile. They create a picture on the navigator to visualize the word problem.
Curated OER
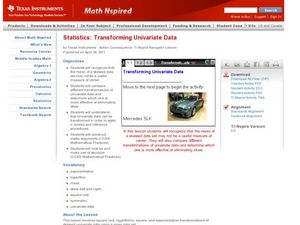
Transforming Univariate Data
Learners analyze plotted data in this statistics activity. They differentiate between skewed and normal data. They also explore and interconnect exponential growth and decay as it relates to the data.
Curated OER
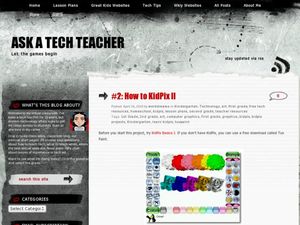
How To KidPix II
Students practice using KidPix to create illustrations. In this visual arts lesson, students define key vocabulary words, such as "palette" and "toolbar" to familiarize themselves with the KidPix program. Students create...
Curated OER
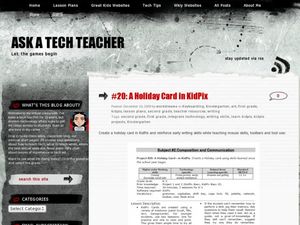
A Holiday Card in KidPix
Students create a holiday card using computer software. In this computer card making lesson, students design an original holiday card using a variety of tools. Students navigate the software utilizing various tools.
Curated OER
A Holiday Calendar in MS Publisher for Elementary School
Students create a holiday calendar using ms word. In this technology lesson, students create their own calendar while learning basic Publisher skills. Students use clipart, explore how to change fonts, and how to use templates.
Curated OER
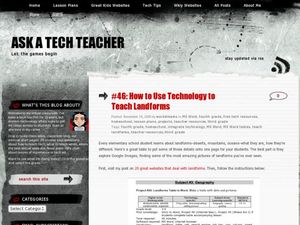
How to Use Technology to Teach Landforms
Students create a landform table on the computer. In this geography lesson, students use Microsoft Word to design a 3 column table. They list different landforms, examples, and attach a picture of each.
Curated OER
Publisher Brochures
Students create brochures on subjects they are studying in Publisher. In this nonfiction writing activity, students use Publisher to create a brochure telling all the main ideas of a topic they are studying. Students use text boxes,...
Curated OER
A Power Point Slide Show for Third Graders
Third graders explore PowerPoint. In this technology lesson, 3rd graders select a topic of interest and follow a guided lesson researching their topic. Students complete storyboards, introductions, table of contents and...
Curated OER
Beginning Graphs in MS Excel
Young scholars practice creating graphs in Microsoft Excel. In this technology lesson, students conduct a random survey and collect data. Young scholars use the Microsoft Excel program to create a bar graph of the data.
Curated OER
How to Graph in Excel
Fourth graders construct data graphs on the Microsoft Excel program. In this statistics lesson, 4th graders formulate questions and collect data. Students represent their results by using Excel.
Curated OER
Excel for Beginners
In this Excel lesson, learners set a formula to check their homework. Students also use clipart, work in groups, and learn to use the tools in the drop-down list.
Curated OER
Teach Inventions with PowerPoint
Learners research famous inventors and what they invented. In this technology lesson, students gather facts about a specific invention and create a PowerPoint slideshow about it. Learners practice adding in animation and color to the...
Curated OER
MS Word Skills Assessment
Students are assessed on their use of the Microsoft Word program. In this word processing assessment, students are asked to complete a list of tasks in the Microsoft Word program to determine their knowledge of the program.


